
All figures (9)
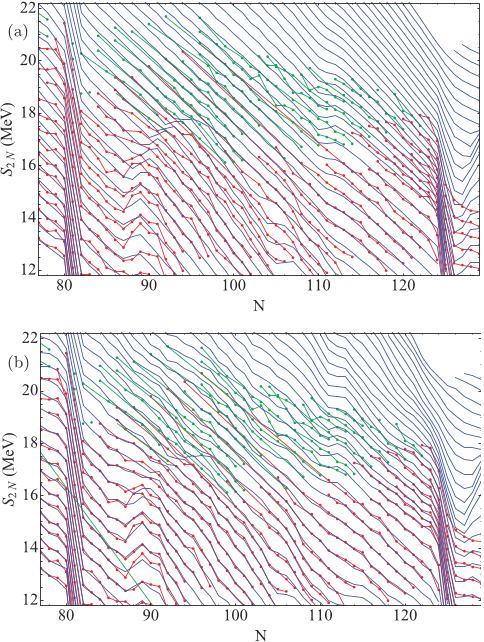 FIG. 4. (Color online) AME95-03 test: Two-neutron separation energies S2n isotopic lines (in blue) predicted by (a) the DZ and (b) its improvement using the CLEAN reconstruction. Red bullets indicate the input (fitted) data and green bullets indicate the benchmark (predicted) data.
 FIG. 5. (Color online) The iteration in the GK process at which each nucleus is predicted in the AME95-03 test.
 FIG. 6. (Color online) (a) σ i and (b) Aσ i as a function of the number of nuclei for each unit of distance predicted in the AME95-03 test for the GK iterative procedure (black circles), LDM (blue stars), LDM improved by CLEAN (blue stars dashed), LDMM (green triangles), LDMM improved by CLEAN (green triangles dashed), DZ (red squares), and DZ improved by CLEAN (red squares dashed).
 FIG. 1. (Color online) Differences between experimental masses and those calculated with the four models: (a) the liquid-drop model (LDM), (b) the liquid-drop model with schematic shell correction (LDMM), (c) the Duflo-Zuker model (DZ), and (d) the Garvey-Kelson relations (GK).
 TABLE III. σ i and Aσ i deviations in MeV for the GK iterative procedure, LDM, LDM improved by CLEAN, LDMM, LDMM improved by CLEAN, DZ, and DZ improved by CLEAN for the AME95-03 test. The second column shows the number of nuclei used for calculating the rms deviations. A graphical comparison of these data is shown in Fig. 6.
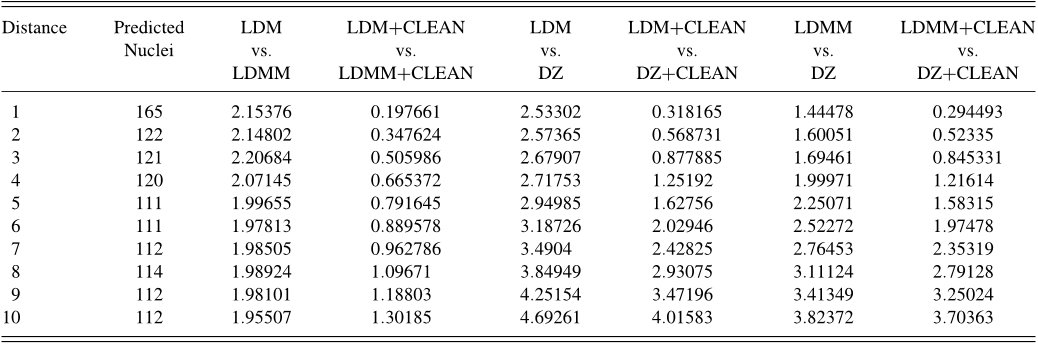 TABLE IV. σ i deviations in MeV as a function of distance between the predictions of the different models considered (LDM, LDMM, and DZ) before and after applying the algorithm CLEAN. The second column shows the number of nuclei used to calculate the rms deviations.
 TABLE II. AME03-border test: Predictability for the set of nuclei in the border of AME03, restricted to N,Z 28.
 FIG. 3. (Color online) AME95-03 test: Two-neutron separation energies S2n isotopic lines (in blue) predicted by (a) the LDMM and (b) its improvement using the CLEAN reconstruction. Red bullets indicate the input (fitted) data and green bullets indicate the benchmark (predicted) data.
 FIG. 2. (Color online) AME95-03 test: Two-neutron separation energies S2n isotopic lines (in blue) predicted by (a) the LDM and (b) its improvement using the CLEAN reconstruction. Red bullets indicate the input (fitted) data and green bullets indicate the benchmark (predicted) data.


