scispace - formally typeset
Search or ask a question
Journal ArticleDOI

Improved spectral comparisons of paleoclimate models and observations via proxy system modeling: Implications for multi-decadal variability

TL;DR: In this paper, a forward proxy modeling approach coupled with an isotope-enabled GCM is proposed to disentangle the various contributions to signals embedded in ice cores, speleothem calcite, coral aragonite, tree-ring width, and tree cellulose, and conclude that the paleoclimate record may exhibit larger low-frequency variability than GCMs currently simulate, indicative of incomplete physics and/or forcings.
About: This article is published in Earth and Planetary Science Letters.The article was published on 2017-10-15 and is currently open access. It has received 39 citations till now. The article focuses on the topics: Climate model.

Summary (2 min read)

2.1. GCM & PSM-Generated Pseudoproxies

  • Each proxy type employs its own unique PSM.
  • The complicated nature of proxy data (e.g. chronological uncertainties and impacts on phasing) precludes point-to-point comparisons of time series, and thus there is a strong case for comparing simulated proxy to the observations in the frequency domain.

3. Case Studies

  • Various approaches including downscaling or bias correction can help to minimize such problems, or paleoclimate data can be aggregated to match GCM grid cell size.
  • For each proxy type, the authors attempt to answer whether the mismatch arises from a lack of low-frequency variability simulated by the GCM SPEEDY-IER, or from a data-model comparison strategy problem.
  • For completeness, the authors report absolute variance for all case studies and the PAGES2k data in SI Section S3.

3.1. Spectral Fingerprinting of Proxy Systems

  • As a first pass, the authors forced each PSM with white noise climate inputs to assess the impact of proxy system processes alone on the shape of the spectra.
  • For ice cores, speleothems, and tree ring widths, the white noise +.
  • For all proxy types, the spectra revert to the shape of the white input climate signal on decadal and longer timescales.
  • Under different PSM formulations these spectra could change significantly, and this non-unicity proves a large source of uncertainty.

3.2.1. Corals

  • Shows that the corals are generally strong SST proxies (or, possibly, that the GCM completely underplays salinity variability).
  • Testing the effects of parametric uncertainty for the corals provides an example of how PSMs can be used to inform data-model comparison.
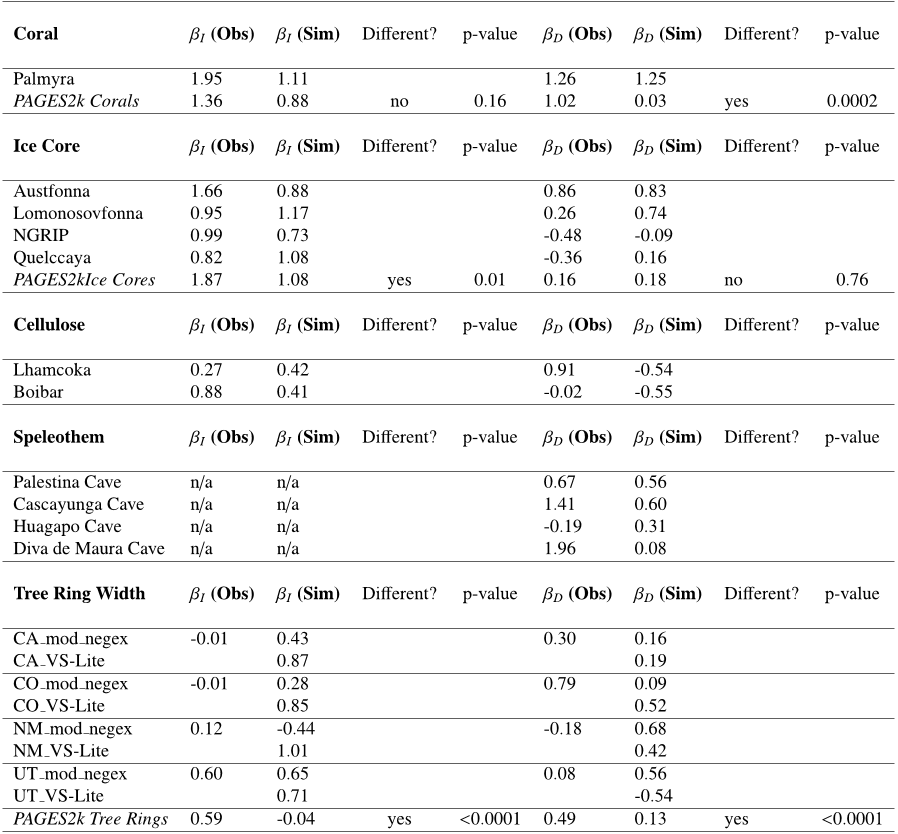
  • More interestingly, discrepancies exist between the simulated and observed power spectrum on decadal to centennial timescales.
  • Further, if the authors instead evaluate both in terms of absolute variance, the Palmyra record exhibits larger σ at the decadal band as compared to the PSM-simulated data (SI Section S3).
  • While the PSM-generated pseudo-coral captures interannual SST variability similar to observations, the PSM seems not to account for the larger variance in the observations on longer timescales, and this discrepancy remains even when uncertainties in the coral's sensitivity to salinity and δ 18 O S W are taken into account.

3.2.2. Ice Cores

  • On decadal to centennial timescales, differences in the observed vs. simulated spectral slopes are more modest than for interannual, but three of the records tend to increasingly diverge at low frequencies (see Fig. 3 ).
  • 18 O PRECIP vs. the observed ice core values exhibit some agreement on multi-decadal frequencies, but the model does not simulate comparable variance in the observations on longer (>centennial) timescales (see Fig. 3 ).
  • This suggests that neither the GCM, the water isotope physics in the GCM, nor the PSM can account for observed low frequency variability.

3.2.3. Speleothems

  • The speleothem PSM highlights the fact that on interannual to decadal timescales, the authors can essentially obtain a β value in agreement with observations simply as a function of the karst parameters.
  • On longer timescales, the simulated spectra tend to flatten while the observed spectra continue to show increased lowfrequency variance, potentially indicative of climate processes resulting in a spectrum similar to what the authors would expect from a power law system (see Fig. 5 ).

3.2.5. Tree Ring Width

  • Aggressive detrending methods tend to remove low frequency variability (demonstrated by Table 2 ).
  • Table 2 also illustrates the RCS method is most conservative in maintaining low-frequency TRW variability.
  • In general, using the same detrending method for both proxy and pseudoproxy is essential.

Did you find this useful? Give us your feedback

Figures (10)
Citations
More filters
Journal ArticleDOI
TL;DR: In this paper, the authors examined interdecadal GMST variability in Coupled Modeling Intercomparison Projects, Phases 3, 5, and 6 (CMIP3, CMIP5, and CMIP6) preindustrial control (piControl), last millennium, and historical simulations and in observational data.
Abstract: Attribution and prediction of global and regional warming requires a better understanding of the magnitude and spatial characteristics of internal global mean surface air temperature (GMST) variability. We examine interdecadal GMST variability in Coupled Modeling Intercomparison Projects, Phases 3, 5, and 6 (CMIP3, CMIP5, and CMIP6) preindustrial control (piControl), last millennium, and historical simulations and in observational data. We find that several CMIP6 simulations show more GMST interdecadal variability than the previous generations of model simulations. Nonetheless, we find that 100‐year trends in CMIP6 piControl simulations never exceed the maximum observed warming trend. Furthermore, interdecadal GMST variability in the unforced piControl simulations is associated with regional variability in the high latitudes and the east Pacific, whereas interdecadal GMST variability in instrumental data and in historical simulations with external forcing is more globally coherent and is associated with variability in tropical deep convective regions. Plain Language Summary Ongoing and future global and regional warming will progress as a combination of internal climate variability and forced climate change. Understanding the magnitude and spatial patterns associated with internal climate variability is an important aspect of being able to predict when, where, and how climate change will be felt around the globe. Here, we show that the latest climate model simulations, which will be used in the Intergovernmental Panel on Climate Change (IPCC) Assessment Report 6 (AR6), simulate a large range in magnitudes of internal global mean temperature variability. Although there are large unforced global temperature trends in some models, we find that even the most variable models never generate unforced global temperature trends equal to the recently observed global warming trends forced by greenhouse gas emissions. We examine the regions associated with internal climate variability and forced climate change in climate model simulations and find that only forced simulations show a pattern of warming consistent with instrumental data.

49 citations


Cites background from "Improved spectral comparisons of pa..."

  • ...…interdecadal GMST variability (Brown et al., 2015, 2017; Parsons & Hakim, 2019), with both instrumental (Laepple & Huybers, 2014a) and paleoclimate (Dee et al., 2017; Laepple & Huybers, 2014b; Parsons et al., 2017) evidence suggesting that climate models may underestimate local, low‐frequency…...

    [...]

Journal ArticleDOI
TL;DR: In this article, a review of the literature focused on proxy-based reconstructions of climate variability during the Holocene (i.e., the last 11.7 thousand years) with a special emphasis on i) proxybased reconstruction methods; ii) available proxy based reconstruction of the main modes of variability, i.e. El Nino Southern Oscillation, Pacific Decadal Variability, Atlantic Multidecadal Vectors, the North Atlantic Oscillations, the Southern Annular Mode and the Indian Ocean Dipole; iii) major interactions between these modes;

44 citations

Journal ArticleDOI
TL;DR: A replicated reconstruction of sea-surface temperature and salinity from a site sensitive to North Atlantic circulation in the Gulf of Mexico which reveals pronounced centennial-scale variability over the late Holocene and reveals that weakened surface-circulation in the Atlantic Ocean was concomitant with well-documented rainfall anomalies in the Western Hemisphere during the Little Ice Age.
Abstract: Surface-ocean circulation in the northern Atlantic Ocean influences Northern Hemisphere climate. Century-scale circulation variability in the Atlantic Ocean, however, is poorly constrained due to insufficiently-resolved paleoceanographic records. Here we present a replicated reconstruction of sea-surface temperature and salinity from a site sensitive to North Atlantic circulation in the Gulf of Mexico which reveals pronounced centennial-scale variability over the late Holocene. We find significant correlations on these timescales between salinity changes in the Atlantic, a diagnostic parameter of circulation, and widespread precipitation anomalies using three approaches: multiproxy synthesis, observational datasets, and a transient simulation. Our results demonstrate links between centennial changes in northern Atlantic surface-circulation and hydroclimate changes in the adjacent continents over the late Holocene. Notably, our findings reveal that weakened surface-circulation in the Atlantic Ocean was concomitant with well-documented rainfall anomalies in the Western Hemisphere during the Little Ice Age.

40 citations

Journal ArticleDOI
TL;DR: In this article, the authors proposed a geosciences at the University of Arizona using the Kartchner Caverns scholarship fund and the National Science Foundation EaSM2 grant.
Abstract: National Science Foundation EaSM2 Grant [AGS-1243125]; Directorate for Geosciences [3008610]; Graduate Research Fellowship [DGE-1143953]; Kartchner Caverns scholarship fund; Department of Geosciences at the University of Arizona

36 citations

References
More filters
Journal ArticleDOI
Moinuddin Ahmed1, Kevin J. Anchukaitis2, Kevin J. Anchukaitis3, Asfawossen Asrat4, H. P. Borgaonkar5, Martina Braida6, Brendan M. Buckley2, Ulf Büntgen7, Brian M. Chase8, Brian M. Chase9, Duncan A. Christie10, Duncan A. Christie11, Edward R. Cook2, Mark A. J. Curran12, Mark A. J. Curran13, Henry F. Diaz14, Jan Esper15, Ze-Xin Fan16, Narayan Prasad Gaire17, Quansheng Ge18, Joelle Gergis19, J. Fidel González-Rouco20, Hugues Goosse21, Stefan W. Grab22, Nicholas E. Graham23, Rochelle Graham23, Martin Grosjean24, Sami Hanhijärvi25, Darrell S. Kaufman26, Thorsten Kiefer, Katsuhiko Kimura27, Atte Korhola25, Paul J. Krusic28, Antonio Lara10, Antonio Lara11, Anne-Marie Lézine29, Fredrik Charpentier Ljungqvist28, Andrew Lorrey30, Jürg Luterbacher31, Valérie Masson-Delmotte29, Danny McCarroll32, Joseph R. McConnell33, Nicholas P. McKay26, Mariano S. Morales34, Andrew D. Moy12, Andrew D. Moy13, Robert Mulvaney35, Ignacio A. Mundo34, Takeshi Nakatsuka36, David J. Nash37, David J. Nash22, Raphael Neukom7, Sharon E. Nicholson38, Hans Oerter39, Jonathan G. Palmer40, Jonathan G. Palmer41, Steven J. Phipps41, María Prieto32, Andrés Rivera42, Masaki Sano36, Mirko Severi43, Timothy M. Shanahan44, Xuemei Shao18, Feng Shi, Michael Sigl33, Jason E. Smerdon2, Olga Solomina45, Eric J. Steig46, Barbara Stenni6, Meloth Thamban47, Valerie Trouet48, Chris S. M. Turney41, Mohammed Umer4, Tas van Ommen13, Tas van Ommen12, Dirk Verschuren49, A. E. Viau50, Ricardo Villalba34, Bo Møllesøe Vinther51, Lucien von Gunten, Sebastian Wagner, Eugene R. Wahl14, Heinz Wanner24, Johannes P. Werner31, James W. C. White52, Koh Yasue53, Eduardo Zorita 
Federal Urdu University1, Columbia University2, Woods Hole Oceanographic Institution3, Addis Ababa University4, Indian Institute of Tropical Meteorology5, University of Trieste6, Swiss Federal Institute for Forest, Snow and Landscape Research7, University of Bergen8, University of Montpellier9, University of Chile10, Austral University of Chile11, University of Tasmania12, Australian Antarctic Division13, National Oceanic and Atmospheric Administration14, University of Mainz15, Xishuangbanna Tropical Botanical Garden16, Nepal Academy of Science and Technology17, Chinese Academy of Sciences18, University of Melbourne19, Complutense University of Madrid20, Université catholique de Louvain21, University of the Witwatersrand22, Hydrologic Research Center23, University of Bern24, University of Helsinki25, Northern Arizona University26, Fukushima University27, Stockholm University28, Université Paris-Saclay29, National Institute of Water and Atmospheric Research30, University of Giessen31, Swansea University32, Desert Research Institute33, National Scientific and Technical Research Council34, British Antarctic Survey35, Nagoya University36, University of Brighton37, Florida State University38, Alfred Wegener Institute for Polar and Marine Research39, University of Exeter40, University of New South Wales41, Centro de Estudios Científicos42, University of Florence43, University of Texas at Austin44, Russian Academy of Sciences45, University of Washington46, National Centre for Antarctic and Ocean Research47, University of Arizona48, Ghent University49, University of Ottawa50, University of Copenhagen51, University of Colorado Boulder52, Shinshu University53
TL;DR: The authors reconstructed past temperatures for seven continental-scale regions during the past one to two millennia and found that the most coherent feature in nearly all of the regional temperature reconstructions is a long-term cooling trend, which ended late in the nineteenth century.
Abstract: Past global climate changes had strong regional expression To elucidate their spatio-temporal pattern, we reconstructed past temperatures for seven continental-scale regions during the past one to two millennia The most coherent feature in nearly all of the regional temperature reconstructions is a long-term cooling trend, which ended late in the nineteenth century At multi-decadal to centennial scales, temperature variability shows distinctly different regional patterns, with more similarity within each hemisphere than between them There were no globally synchronous multi-decadal warm or cold intervals that define a worldwide Medieval Warm Period or Little Ice Age, but all reconstructions show generally cold conditions between ad 1580 and 1880, punctuated in some regions by warm decades during the eighteenth century The transition to these colder conditions occurred earlier in the Arctic, Europe and Asia than in North America or the Southern Hemisphere regions Recent warming reversed the long-term cooling; during the period ad 1971–2000, the area-weighted average reconstructed temperature was higher than any other time in nearly 1,400 years

885 citations

Journal ArticleDOI
17 Jul 2003-Nature
TL;DR: Fossil-coral oxygen isotopic records from Palmyra Island are splice together to provide 30–150-year windows of tropical Pacific climate variability within the last 1,100 years, implying that the majority of ENSO variability over the last millennium may have arisen from dynamics internal to the ENSo system itself.
Abstract: Any assessment of future climate change requires knowledge of the full range of natural variability in the El Nino/Southern Oscillation (ENSO) phenomenon. Here we splice together fossil-coral oxygen isotopic records from Palmyra Island in the tropical Pacific Ocean to provide 30–150-year windows of tropical Pacific climate variability within the last 1,100 years. The records indicate mean climate conditions in the central tropical Pacific ranging from relatively cool and dry during the tenth century to increasingly warmer and wetter climate in the twentieth century. But the corals also document a broad range of ENSO behaviour that correlates poorly with these estimates of mean climate. The most intense ENSO activity within the reconstruction occurred during the mid-seventeenth century. Taken together, the coral data imply that the majority of ENSO variability over the last millennium may have arisen from dynamics internal to the ENSO system itself.

877 citations

Journal ArticleDOI
TL;DR: A 3D 1° × 1° gridded data set for the annual mean seawater oxygen isotope ratio (δ18O) to use in oceanographic and paleoceanographic applications is presented in this article.
Abstract: [1] We present a new 3-dimensional 1° × 1° gridded data set for the annual mean seawater oxygen isotope ratio (δ18O) to use in oceanographic and paleoceanographic applications. It is constructed from a large set of observations made over the last 50 years combined with estimates from regional δ18O to salinity relationships in areas of sparse data. We use ocean fronts and water mass tracer concentrations to help define distinct water masses over which consistent local relationships are valid. The resulting data set compares well to the GEOSECS data (where available); however, in certain regions, particularly where sea ice is present, significant seasonality may bias the results. As an example application of this data set, we use the resulting surface δ18O as a boundary condition for isotope-enabled GISS ModelE to yield a more realistic comparison to the isotopic composition of precipitation data, thus quantifying the ‘source effect’ of δ18O on the isotopic composition of precipitation.

755 citations

Journal ArticleDOI
TL;DR: In this article, the authors show the results of spectral analyses of treering data from northern Sweden and show that only a few peaks in the spectra are consistently significant when the data are analyzed over a number of sub-periods.
Abstract: Quantitative estimates of 1480 years of summer temperatures in northern Fennoscandia have previously been derived from continuous treering records from northern Sweden. Here we show the results of spectral analyses of these data. Only a few peaks in the spectra are consistently significant when the data are analyzed over a number of sub-periods. Relatively timestable peaks are apparent at periods of 2.1, 2.5, 3.1, 3.6, 4.8, ∼ 32–33 and for a range between ∼ 55–100 years. These results offer no strong evidence for solar-related forcing of summer temperatures in these regions. Our previously published reconstruction was limited in its ability to represent long-timescale temperature change because of the method used to standardize the original tree-ring data. Here we employ an alternative standardization technique which enables us to capture temperature change on longer timescales. Considerable variance is now reconstructed on timescales of several centuries. In comparison with modern normals (1951–70) generally extended periods when cool conditions prevailed, prior to the start of the instrumental record, include 500–700, 790–870, 1110–1150, 1190–1360, 1570–1750 (A.D.) with the most significant cold troughs centred on about 660, 800, 1140, 1580–1620 and 1640. Predominantly warm conditions occurred in 720–790, 870–1110 and 1360–1570 with peaks of warmth around 750, 930, 990, 1060, 1090, 1160, 1410, 1430, 1760 and 1820.

675 citations

Journal ArticleDOI
TL;DR: In this paper, the problem of constructing millennia-long tree-ring chronologies from overlapping segments of cross-dated ringwidth series is reviewed, with an emphasis on preserving very low-frequency signals.
Abstract: The problem of constructing millennia-long tree-ring chronologies from overlapping segments of cross-dated ring-width series is reviewed, with an emphasis on preserving very low-frequency signals p...

647 citations

Related Papers (5)
Julien Emile-Geay, Nicholas P. McKay, Darrell S. Kaufman, Lucien von Gunten, Jianghao Wang, Kevin J. Anchukaitis, Nerilie J. Abram, Jason A. Addison, Mark A. J. Curran, Mark A. J. Curran, Michael N. Evans, Benjamin J. Henley, Zhixin Hao, Belen Martrat, Belen Martrat, Helen McGregor, Raphael Neukom, Gregory T. Pederson, Barbara Stenni, Kaustubh Thirumalai, Johannes P. Werner, Chenxi Xu, Dmitry Divine, Bronwyn C. Dixon, Joelle Gergis, Ignacio A. Mundo, Takeshi Nakatsuka, Steven J. Phipps, Cody C. Routson, Eric J. Steig, Jessica E. Tierney, Jonathan J. Tyler, Kathryn Allen, Nancy A. N. Bertler, Jesper Björklund, Brian M. Chase, Min Te Chen, Edward R. Cook, Rixt de Jong, Kristine L. DeLong, Daniel A. Dixon, Alexey A. Ekaykin, Alexey A. Ekaykin, Vasile Ersek, Helena L. Filipsson, Pierre Francus, Mandy Freund, Massimo Frezzotti, Narayan Prasad Gaire, Narayan Prasad Gaire, Konrad Gajewski, Quansheng Ge, Hugues Goosse, Anastasia Gornostaeva, Martin Grosjean, Kazuho Horiuchi, Anne Hormes, Katrine Husum, Elisabeth Isaksson, Selvaraj Kandasamy, Kenji Kawamura, Kenji Kawamura, K. Halimeda Kilbourne, Nalan Koc, Guillaume Leduc, Hans W. Linderholm, Andrew Lorrey, Vladimir Mikhalenko, P. Graham Mortyn, Hideaki Motoyama, Andrew D. Moy, Andrew D. Moy, Robert Mulvaney, Philipp Munz, David J. Nash, David J. Nash, Hans Oerter, Thomas Opel, Anais Orsi, Dmitriy V. Ovchinnikov, Trevor J. Porter, Heidi A. Roop, Casey Saenger, Masaki Sano, David J. Sauchyn, Krystyna M. Saunders, Krystyna M. Saunders, Marit-Solveig Seidenkrantz, Mirko Severi, Xuemei Shao, Marie-Alexandrine Sicre, Michael Sigl, Kate E. Sinclair, Scott St. George, Jeannine-Marie St. Jacques, Jeannine-Marie St. Jacques, Meloth Thamban, Udya Kuwar Thapa, Elizabeth R. Thomas, Chris S. M. Turney, Ryu Uemura, A. E. Viau, Diana Vladimirova, Diana Vladimirova, Eugene R. Wahl, James W. C. White, Zicheng Yu, Jens Zinke, Jens Zinke 
Frequently Asked Questions (1)
Q1. What contributions have the authors mentioned in the paper "Improved spectral comparisons of paleoclimate models and observations via proxy system modeling: implications for multi-decadal variability" ?

In this paper the authors bridge this gap via a forward modeling approach, coupled to an isotope-enabled GCM. The paper addresses the following questions: ( 1 ) do forward modeled “ pseudoproxies ” exhibit variability comparable to proxy data ? The authors apply their method to representative case studies, and parlay these insights into an analysis of the PAGES2k database ( ? ). The authors conclude that, specific to this set of PSMs and isotope-enabled model, the paleoclimate record may exhibit larger low-frequency variability than GCMs currently simulate, indicative of ∗Corresponding author Email addresses: sylvia 11 dee @ brown. The authors find that current proxy system models ( PSMs ) can help resolve model-data discrepancies on interannual to decadal timescales, but can not account for the mismatch in variance on multi-decadal to centennial timescales.