
All figures (10)
 Figure 6. Bulk modulus B0 as a function of B-vacancy concentration x in MB2-x for M = Ti, Zr, Hf, V, Nb, Ta, Cr, Mo, W.
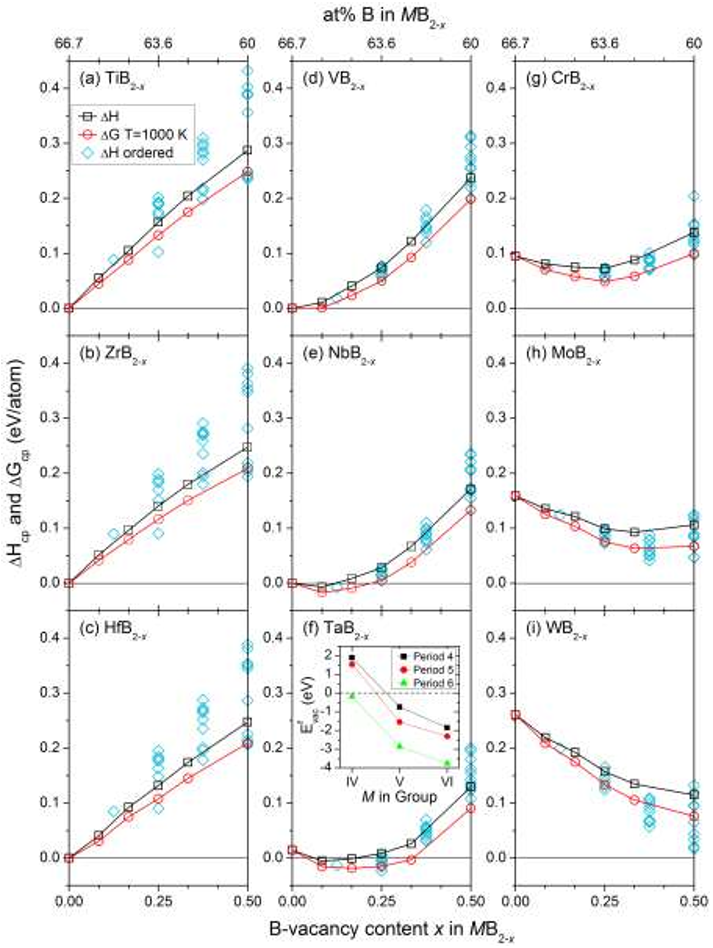 Figure 3. Formation enthalpy ∆𝐻cp of ordered (◊) and disordered (□) B-vacancies in MB2-x as well as mean field free energy ∆𝐺cp at 1000 K (○) for a disordered vacancy distribution using Eq. 2 and 3, as a function of B-vacancy concentration x for M = Ti, Zr, Hf, V, Nb, Ta, Cr, Mo, W. Negative values indicate favored B-vacancy formation. ∆𝐻cp and ∆𝐺cp is calculated using Eq. 2 and 3, respectively. The inset in panel (d) shows the monovacancy formation energy 𝐸vac f of B in MB2-x as function of M in group VI, V, and VI.
 Figure 7. Total (1) and projected M d (2) and B s and p (3) density of states for MB2 where M = Ti, Zr, Nb, and Mo. Vertical lines indicate the Fermi level Ef.
 Figure 2. Formation energy ∆𝐸1 of M1-yBy binary phases as a function of B concentration y for M = Ti, Zr, Hf, V, Nb, Ta, Cr, Mo, W using Eq. 1. The formation energy of the hexagonal AlB2 type structure of MB2 upon B-vacancy formation is represented by (×), with increasing vacancy concentration going to the left. Binary phases with ∆𝐸1 < 0 are stable with respect to M and B. The black line represents the convex hull, excluding MB2-x when x ≠ 0. Phases which do not belong to the convex hull are represented by blue circles (○). See Table A2 for a complete list of competing phases.
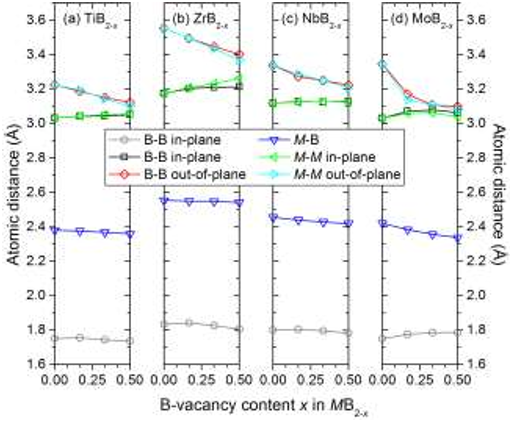 Figure 5. Average atomic distances for in- and out-of-plane B-B, in- and out-of-plane M-M, and M-B of MB2-x where M = Ti, Zr, Nb, Mo and for x = 0 and at three selected B-vacancy concentrations, x = 0.167, 0.250, 0.500.
 Table 3. Identified set of most competing phases for MB2-x, where M = Ti, Zr, Hf, V, Nb, Ta, Cr, Mo, W and 0 ≤ x ≤ 0.5.
 Table 1. Data for MB2-x supercell of size 4×4×3 unit cells (4a × 4a × 3c).
 Figure 8. (a – d) Total density of states for MB2-x where M = Ti, Zr, Nb, Mo at four selected Bvacancy concentrations. Vertical lines indicate the Fermi level Ef. In (e) the states at the Fermi level N(Ef) is given as function of the B-vacancy concentration x.
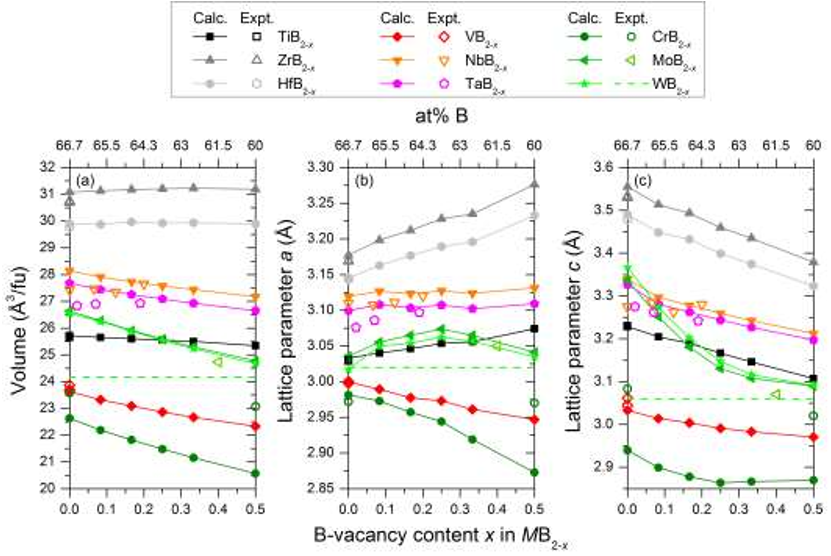 Figure 4. Calculated volume (a) and lattice parameters a (b) and c (c) as a function of B-vacancy concentration x in MB2-x for M = Ti, Zr, Hf, V, Nb, Ta, Cr, Mo, W (filled symbols). For
 Table 2. List of ordered B-vacancies considered for MB2-x where x = 0.125, 0.25, 0.375, and 0.5. The position of the B-vacancies are given by the numbers within parenthesis, which correspond to the enumeration of B-atoms in Fig. 1(b).


