
All figures (14)
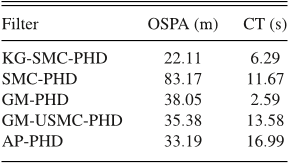 TABLE V Filter Performance Comparison in Terms of OSPA Distance and CT for λ = 20 with Measurement Set Partition
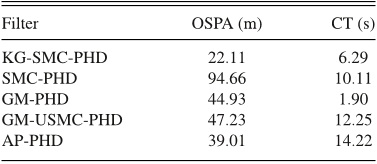 TABLE VI Filter Performance Comparison in Terms of OSPA Distance and CT for Different Filters for λ = 20 without Measurement Set Partition
 Fig. 6. OSPA distance averaged over 1000 MC runs for clutter rate of 20 Poisson clutter (λ = 20) per scan (ć = 300, ṕ = 1).
 Fig. 7. Averaged OSPA distances versus varying clutter intensity over 1000 MC trials.
 Fig. 2. Schematic representation of the proposed SMC-PHD filter showing the 2-D state space of the PHD of two targets populated with particles. The contours represent the state space of targets. The contour centers and number of centers represent the mode and number of targets, respectively. Boxes A, B, C, and D represent various stages of the filter. The square-shaped and diamond-shaped particles are for target 1 and target 2, respectively. The colors stand for different particle states. The particles with “ √ ” stand for particles with higher weight for when latest the observation arrives.
 Fig. 4. True and KG-SMC-PHD filter cardinality estimates of targets time averaged over 1000 MC trials with ρ = 500 particles per existing track.
 Fig. 5. x and y components (versus time) of the true target trajectories and the KG-SMC-PHD filter estimates for ρ = 500 particles per existing track.
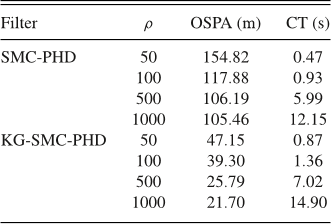 TABLE IV Filter Performance in Terms of Number of Particles, OSPA Distance, and CT for λ = 30 with Measurement Partition
 TABLE III Filter Performance in Terms of Number of Particles, OSPA Distance, and CT for λ = 20 with Measurement Partition
 Fig. 3. True target trajectories in the range-bearing plane with start/end positions for each track shown with ©/ .
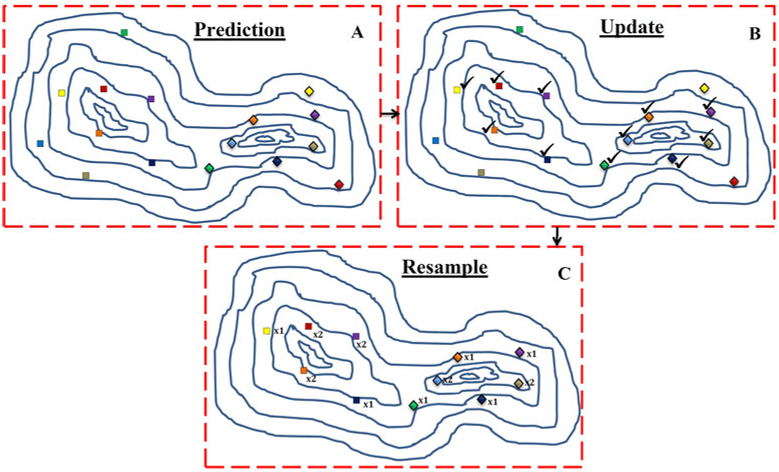 Fig. 1. Schematic representation of the standard SMC-PHD filter showing the 2-D state space of the PHD of two targets populated with particles. The contours represent the state space of targets. The contour centers and number of centers represent the mode and cardinality of targets, respectively. Boxes A, B, and C represent various stages of the filter. The square-shaped and diamond-shaped particles are for target 1 and target 2, respectively. The colours stand for different particle states. The particles marked with “ √ ” in B denote particles with higher weight for when the latest observation arrives.
 Fig. 8. KG-SMC-PHD and SMC-PHD filter performance evaluation in terms of OSPA distance and CT versus varying number of particles time averaged over 1000 MC trials for λ = 20.
 TABLE II Filter Performance Comparison in Terms of OSPA Distance, CT, and PD for λ = 30 and ρ = 1000 with Measurement Partition
 TABLE I Filter Performance Comparison in Terms of OSPA Distance, CT, and PD for λ = 20 and ρ = 1000 with Measurement Partition


