
All figures (169)
 Figure 3.24. (contd)
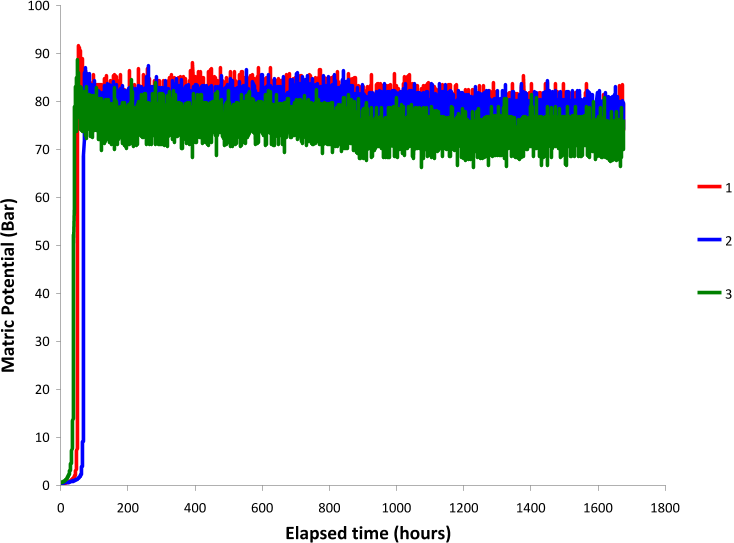 Figure 2.90. Water Potential as a Function of Time for HDU-1, HDU-2, and HDU-3 (Experiment II)
 Figure 2.91. Water Potential as a Function of Time for HDU-4, HDU-5, and HDU-6 (Experiment II)
 Figure 3.10. Temperature Breakthrough Curves for Air Injected at 50°C with a Relative Humidity of a) 10% and b) 100%
 Figure 3.13. Comparison of STOMP77 and STOMP90 Using the Tensorial Conductivity Capability
 Figure 2.49. Relative Humidity as a Function of Time for Experiment IV-d-4
 Figure 2.50. Temperature as a Function of Time for Experiment IV-d-4
 Figure 3.28. Volume of Water Within the Desiccated Zone for Multiple Desiccation Applications
 Figure 3.37. Temporal Profile of Average Mass Flux in the Domain Across the Water Table from the
 Figure 2.27. Simulated and Measured Water Saturations Before and After Diffusive Rewetting for Experiment III-1
 Figure 2.28. Simulated and Measured Relative Humidity Before and After Diffusive Rewetting for Experiment III-1
 Figure 2.6. Fluid Saturations After Fluids were Allowed to Redistribute for 14 Days After Packing for Experiments 70-0-0 and 70-500-0. Fluid saturations were determined gravimetrically.
 Figure 2.5. Normalized Nitrate Concentrations for Experiments 40/50-1-4, 40/50-10-4, and 40/50-100-4, and 40/50-500-4
 Figure 2.20. Relative Humidity in the Column During Diffusive Rewetting for Experiment I-2
 Figure 2.19. Simulated and Measured Relative Humidity Before and After Diffusive Rewetting for Experiment I-2
 Figure 2.7. Normalized Nitrate Concentrations (actual concentration/18,200 mg/Kg) After Fluids were Allowed to Redistribute for 14 Days After Packing for Experiment 70-500-0
 Figure 2.8. Normalized Nitrate Concentrations for Experiments 70-1-1, 70-10-1, 70-100-1, and 70-500-1
 Figure 2.43. Water Saturation as a Function of Time for Experiment IV-d-3
 Figure 3.16. Selection of Targeted Desiccation Zones Based on Available Borehole Data Presented in Ward et al. (2004). Desiccation intervals are designated as Xt-Yd where X is the thickness of the zone (meters) and Y is the mid-depth of the zone (meters below ground surface).
 Figure 3.40. Simulated Desiccation (change in water content) Along the Centerline from the Injection to the Extraction Wells (mid-screen depth) for 100/100 cfm Injection/Extraction Flow Rates
 Figure 3.41. Simulated Desiccation (change in water content) Along the Centerline from the Injection to the Extraction Wells (mid-screen depth) for 300/300 cfm Injection/Extraction Flow Rates
 Table 2.2. Overview of Experiments Conducted with 70-Mesh Sand. For all experiments, 50 mL of
 Figure 2.34. Relative Humidity as a Function of Time for Experiment IV-d-1
 Figure 2.33. Water Saturation During Desiccation for Experiment IV-d-1
 Figure 2.98. Relative Humidity (%) as a Function of Time for H-10, H-11, and H-12 During Desiccation for Experiment II. Probes 10 and 12 returned no signal until the humidity started
 Figure 2.99. Relative Humidity (%) as a Function of Time for H-13, H-14, and H-15 During Desiccation for Experiment II
 Figure 3.36. Cumulative Technetium Mass Moved Across the Water Table from the Vadose Zone to the
 Figure 2.52. Relative Humidity as a Function of Time for Experiment IV-r-4
 Figure 2.51. Water Saturation as a Function of Time for Experiment IV-r-4
 Figure 2.77. Picture of Flow Cell After 1 Week of Redistribution of Injected 500-mL Water in the Upper Part of 100-Mesh Sand Wellbore (Experiment I)
 Figure 3.49. Plan (mid-screen depth) and Cross Sectional Views of the Pressure Gradients for 300/300 cfm Injection/Extraction Flow Rates. Injection Well is at –6 m and the Extraction Well is at 6 m.
 Figure 3.5. Relative Humidity After 50 cm of Column Desiccation for the Webb (2000) and Fayer and Simmons (1995) Extensions
 Figure 3.4. Aqueous Saturation After 50 cm of Column Desiccation for the Webb (2000) and Fayer and Simmons (1995) Extensions
 Figure 3.14. Examples of Modeled Relationship Between Moisture Content and Matric Potential
 Figure 2.84. Initial Conditions for Experiment II. The matrix consists of Hanford sediment and the wellbore material is 100-mesh sand.
 Figure 2.85. Schematic of Experiment II with Location of Instruments. At each location, a heat dissipation unit, a thermistor, and a humidity probe were used.
 Figure 3.32. Cumulative Technetium Mass Moved Across the Water Table from the Vadose Zone to the
 Figure 2.58. Water Saturation as a Function of Time for Experiment V-d-2
 Figure 2.57. Relative Humidity as a Function of Time for Experiment V-r-1
 Figure 3.21. (contd)
 Figure 2.93. Water Potential as a Function of Time for HDU-10, HDU-11, and HDU-12 (Experiment II)
 Figure 2.92. Water Potential as a Function of Time for HDU-7, HDU-8, and HDU-9 (Experiment II)
 Figure 3.22. Case 10t-35d Simulated Moisture Content Distribution for a) Just After the First Imposed
 Figure 2.71. Schematic of Experiment I with Instrument Locations. Hanford sediment is material from the Buried Waste Test Facility.
 Figure 2.72. Flow Cell During Packing of Experiment I. All instrument cables were 50-ft long to mimic length requirements at the field site.
 Figure 2.55. Temperature as a Function of Time for Experiment V-d-1
 Figure 2.56. Water Saturation as a Function of Time for Experiment V-r-1
 Figure 3.11. a) Domain used for Scalable Verification of STOMP90 with a Surface Barrier, and b) Pressure Differences Between Simulations Executed on the Personal Computer and Supercomputer
 Figure 2.86. Picture of Flow Cell After 2 Days (48 hours) of Desiccation (Experiment II)
 Table 2.9. Porous Medium and Hydraulic Properties of Hanford Sediment and 100-Mesh Colorado Sand for Experiment II
 Figure 3.1. Comparison of Analytical and STOMP Numerical Solutions for a) the Rossi-Nimmo Junction Model and b) the Rossi-Nimmo Sum Model
 Figure 2.13. Normalized Nitrate Concentrations for Experiments Hs-1-4, Hs-10-4, Hs-100-4, and Hs-500-4 at 4 L/min Flow Rate
 Figure 2.12. Normalized Nitrate Concentrations for Experiments Hs-1-1, Hs-10-1, Hs-100-1, and Hs-500-1 at 1 L/min Flow Rate
 Figure 2.21. Simulated and Measured Water Saturations Before and After Diffusive Rewetting for Experiment II-1
 Figure 3.44. Simulated Temperature Profile During Desiccation Along the Centerline from the Injection to the Extraction Wells (mid-screen depth) for 300/100 cfm Injection/Extraction Flow
 Figure 3.45. Simulated Temperature Profile During Desiccation Along the Centerline from the Injection to the Extraction Wells (mid-screen depth) for 100/100 cfm Injection/Extraction Flow
 Table 2.3. Overview of Experiments Conducted with Hanford Site Sand. For all experiments, 50 mL of
 Figure 2.1. Fluid Saturations After Fluids were Allowed to Redistribute for 14 Days After Packing for Experiments 40/50-0-0 and 40/50-500-0. Fluid saturations were determined gravimetrically.
 Figure 3.24. (contd)
 Table 2.7. Gas Flow Rates and Duration of the Advective Vapor-Phase Rewetting Experiments
 Figure 2.97. Relative Humidity (%) as a Function of Time for H-7, H-8, and H-9 During Desiccation for Experiment II. All probes returned no signal until humidity started decreasing.
 Figure 2.62. Relative Humidity as a Function of Time for Experiment VI-d-1
 Figure 2.96. Relative Humidity (%) as a Function of Time for H-4, H-5, and H-6 During Desiccation for Experiment II. Probes 4 and 5 returned no signal until the humidity started decreasing
 Figure 3.22. Case 10t-35d Simulated Moisture Content Distribution for a) Just After the First Imposed
 Figure 2.65. Relative Humidity as a Function of Time for Experiment VI-r-1
 Figure 2.64. Water Saturation as a Function of Time for Experiment VI-r-1
 Figure 2.104. Extended Calibration Relation for TCP Water Potential as Function of TCP Output. The graph clearly demonstrates expected nonlinearities at higher water potentials.
 Figure 3.39. Simulated Desiccation (change in water content) Along the Centerline from the Injection to the Extraction Wells (mid-screen depth) for 300/100 cfm Injection/Extraction Flow Rates
 Figure 2.44. Relative Humidity as a Function of Time for Experiment IV-d-3
 Figure 2.45. Temperature as a Function of Time for Experiment IV-d-3
 Figure 3.27. Volume of Water Within the Desiccated Zone
 Figure 3.8. X-Z Slice Showing the Grid Discretization Used in the Conceptual Model Testing
 Figure 3.15. Simulated Distribution of Tc-99 in the Vadose Zone in the Year 2012
 Figure 2.76. Picture of Flow Cell After Injection of 500 mL of Water in the Upper Part of 100-Mesh Sand Wellbore (Experiment I)
 Figure 2.75. Picture of Flow Cell at the End of 576-Hour Desiccation Period (Experiment I)
 Figure 2.103. Example of Calibrated Water Potential as a Function of TCP Output for Three Different Temperatures
 Figure 3.19. Case 10t-45d Simulated Moisture Content Distribution for a) Just After Imposed Desiccation (year 2023), b) When the Desiccated Zone is Half Rewetted (year 2032), and c) When the Desiccated Zone is Fully Rewetted (year 2037)
 Figure 2.26. Relative Humidity in the Column During Diffusive Rewetting for Experiment II-2
 Figure 2.70. Instrumentation of Experiment I. The instruments in each bundle, from top to bottom are, upper thermistor, lower thermistor, thermocouple psychrometer, dual-probe heat pulse
 Figure 3.18. Case 10t-35d Simulated Moisture Content Distribution for a) Just After Imposed Desiccation (year 2012), b) When the Desiccated Zone is Half Rewetted (year 2022), and c) When the Desiccated Zone is Fully Rewetted (year 2040)
 Figure 3.3. van Genuchten (1980) Saturation Function with No Extension, Fayer and Simmons (1995) Extension, and Webb (2000) Extension for a Typical Hanford Sediment
 Table 2.6. Initial Desiccation Zone Length and Experiment Duration for the Diffusive Vapor-Phase Rewetting Experiments
 Figure 3.46. Simulated Temperature Profile During Desiccation Along the Centerline from the Injection to the Extraction Wells (mid-screen depth) for 300/300 cfm Injection/Extraction Flow
 Figure 2.63. Temperature as a Function of Time for Experiment VI-d-1
 Figure 3.33. Temporal Profile of Average Mass Flux in the Domain Across the Water Table from the
 Figure 2.3. Normalized Nitrate Concentrations (actual concentration/182.3 mg/Kg) for Experiments 40/50-10-1a, 40/50-10-1b, and 40/50-10-1c
 Figure 2.2. Normalized Nitrate Concentrations (actual concentration/9,117 mg/Kg) After Fluids were Allowed to Redistribute for 14 Days After Packing for Experiment 40/50-500-0
 Figure 2.31. Simulated and Measured Relative Humidity Before and After Diffusive Rewetting for Experiment III-2
 Figure 2.32. Relative Humidity in the Column During Diffusive Rewetting for Experiment III-2
 Figure 2.10. Fluid Saturations After Columns were Allowed to Redistribute for 14 Days After Packing for Experiments Hs-0-0 and Hs-500-0. Fluid saturations were determined gravimetrically.
 Figure 2.88. Picture of Flow Cell Directly After Injection of 500 mL of Water (Experiment II)
 Figure 2.54. Relative Humidity as a Function of Time for Experiment V-d-1
 Figure 2.53. Water Saturation as a Function of Time for Experiment V-d-1
 Figure 3.12. Comparison of Analytical, STOMP77, and STOMP90 Numerical Solutions for a) the Rossi-Nimmo Junction Model and b) the Rossi-Nimmo Sum Model
 Figure 2.11. Normalized Nitrate Concentrations (Actual Concentration/18,201 Mg/Kg) After Fluids were Allowed to Redistribute for 14 Days After Packing for Experiment Hs-500-0
 Figure 2.46. Water Saturation as a Function of Time for Experiment IV-r-3
 Figure 2.47. Relative Humidity as a Function of Time for Experiment IV-r-3
 Figure 3.29. Temporal Profile of Average Water Flux in the Domain Across the Water Table from the Vadose Zone to the Groundwater with the No-Barrier Response for a Surface Infiltration Condition of 25 mm/yr and the Barrier-Only Response of 0.5 mm/yr. Individual plots
 Figure 2.38. Water Saturation as a Function of Time for Experiment IV-d-2
 Figure 2.87. Picture of Flow Cell After 10 Days (240 hours) of Desiccation (Experiment II)
 Figure 3.43. Depiction of Gas Flow Rate in a Y-Z Plane Located Between the Injection and Extraction
 Figure 1. A 229 Heat-Dissipation Matric Water Potential Sensor is Shown at the Top (the dashed line is in clear color). The hypodermic assembly (without epoxy and ceramic) is shown just below.
 Figure 2.82. Humidity Probe Readings During Desiccation (<576 hr) and Rewetting Period (>576 hr) for Experiment I
 Figure 2.81. Heat Dissipation Unit Readings During Desiccation (<576 hr) and Rewetting Period (>576 hr) for Experiment I
 Figure 2.73. Picture of Flow Cell After 24 Hours of Desiccation (Experiment I)
 Figure 3.23. Case 10t-45d Simulated Moisture Content Distribution for a) Just After the First Imposed
 Figure 2.74. Picture of Flow Cell After 1 Week (168 hr) of Desiccation (Experiment I)
 Figure 2.22. Simulated and Measured Relative Humidity Before and After Diffusive Rewetting for Experiment II-1
 Figure 2.23. Relative Humidity in the Column During Diffusive Rewetting for Experiment II-1
 Figure 3.20. Case 30t-35d Simulated Moisture Content Distribution for a) Just After Imposed Desiccation (year 2012), b) When the Desiccated Zone is Half Rewetted (year 2090), and c) When the Desiccated Zone is Fully Rewetted (year 2338)
 Figure 3.26. Aqueous Flux Just Below the Desiccated Zone
 Figure 2.95. Relative Humidity (%) as a Function of Time for H-1, H-2, and H-3 During Desiccation for Experiment II. Probes 2 and 3 returned no signal until the humidity started decreasing
 Figure 3.38. Conceptual Model of Well Configuration used to Simulate Airflow Between Two Wells
 Figure 3.7. Plots of Aqueous Saturations and Pressures for Wedge-Shaped Domain
 Figure 2.79. Thermocouple Psychrometer Readings During Desiccation (<576 hr) and Rewetting Period (>576 hr) for Experiment I
 Figure 2.80. Dual Pulse Heat Probe Readings During Desiccation (<576 hr) and Rewetting Period (>576 hr) for Experiment I
 Figure 2.15. Simulated and Measured Water Saturations Before and After Diffusive Rewetting for Experiment I-1
 Figure 2.16. Simulated and Measured Relative Humidity Before and After Diffusive Rewetting for Experiment I-1
 Figure 3.47. Plan (mid-screen depth) and Cross Sectional Views of the Pressure Gradients for 300/100 cfm Injection/Extraction Flow Rates. Injection well is at –6 m and the extraction well is at 6 m.
 Figure 3.30. Temporal Profile of Average Water Flux in the Domain Across the Water Table from the
 Figure 2.36. Water Saturation as a Function of Time for Experiment IV-r-1
 Figure 2.37. Relative Humidity as a Function of Time for Experiment IV-r-1
 Figure 2.61. Water Saturation as a Function of Time for Experiment VI-d-1
 Figure 3.34. Temporal Profile of Average Mass Flux in the Domain Across the Water Table from the
 Figure 2.102. Relative Humidity (%) as a function of time for H-5, H-6, H-9, H-11, and H-12 During Rewetting Event for Experiment II
 Figure 2.40. Temperature as a Function of Time for Experiment IV-d-2
 Figure 2.39. Relative Humidity as a Function of Time for Experiment IV-d-2
 Figure 2.67. Relative Humidity as a Function of Time for Experiment VII-r-2
 Figure 2.66. Relative Humidity as a Function of Time for Experiment VII-r-1
 Figure 3.17. Case 10t-15d Simulated Moisture Content Distribution for a) Just After Imposed Desiccation (year 2012), b) When the Desiccated Zone is Half Rewetted (year 2032), and c) When the Desiccated Zone is Fully Rewetted (year 2090)
 Table 2.4. Hydraulic and Thermal Properties of the Three Porous Media, Column Wall Material (polycarbonate), and Insulation Material (PVC)
 Table 2.5. Overview of Diffusive (Experiments I–III) and Advective (Experiments IV–VIII) VaporPhase Rewetting Column Experiments
 Figure 2.29. Relative Humidity in the Column During Diffusive Rewetting for Experiment III-1
 Figure 2.30. Simulated and Measured Water Saturations Before and After Diffusive Rewetting for Experiment III-2
 Figure 2.89. Picture of Flow Cell After 7 Days (168 hours) of Water Redistribution (Experiment II)
 Figure 3.2. van Genuchten (1980) Saturation Function with No Extension, Fayer and Simmons (1995) Extension, and Webb (2000) Extension for a Palouse Soil
 Figure 2.25. Simulated and Measured Relative Humidity Before and After Diffusive Rewetting for Experiment II-2
 Figure 2.24. Simulated and Measured Water Saturations Before and After Diffusive Rewetting for Experiment II-2
 Figure 2.9. Normalized Nitrate Concentrations for Experiments 70-1-4, 70-10-4, 70-100-4, and 70-500-4
 Table 3.4. Gas Flow Rate Through a Y-Z Plane Located Between the Injection and Extraction Wells at a Distance of 3 m from the Injection Well in a Cross Sectional Area of 57 m2 (8.5 m in the
 Figure 3.42. Depiction of Gas Flow Rate in a Y-Z Plane Located Between the Injection and Extraction Wells at a Distance of 3 m from the Injection Well. The extraction well is 12 m from the
 Figure 2.48. Water Saturation as a Function of Time for Experiment IV-d-4
 Figure 3.9. Comparison of Gas Pressure and Velocity Fields for Equivalent a) Mass and b) Volumetric Extraction Rates
 Figure 3.25. Total Volume of Water Just Above the Desiccated Zone
 Figure 2.4. Normalized Nitrate Concentrations for Experiments 40/50-1-1, 40/50-10-1a, and 40/50-100-1, and 40/50-500-1
 Table 2.8. Porous Medium and Hydraulic Properties of Hanford Sediment and Monitoring Borehole Sands for Experiment I
 Figure 3.35. Temporal Profile of Average Water Flux in the Domain Across the Water Table from the
 Figure 2.18. Simulated and Measured Water Saturations Before and After Diffusive Rewetting for Experiment I-2
 Figure 2.17. Relative Humidity at Three Locations During Diffusive Rewetting for Experiment I-1
 Figure 3.31. Cumulative Technetium Mass Moved Across the Water Table from the Vadose Zone to the
 Figure 2.14. Example of 1-m Column used for Diffusive and Advective Vapor Phase Rewetting Experiments. The columns were scanned using a dual-energy gamma radiation scanner before and after vapor-phase rewetting. A 1-in. insulation sleeve was wrapped around the column during rewetting.
 Figure 2.41. Water Saturation as a Function of Time for Experiment IV-r-2
 Figure 2.42. Relative Humidity as a Function of Time for Experiment IV-r-2
 Table 2.1. Overview of Experiments Conducted with 40/50-Mesh Accusand. For all experiments,
 Figure 3.6. Temperature After 50 cm of Column Desiccation for the Webb (2000) and Fayer and Simmons (1995) Extensions
 Table 3.2. Mid-Depths and Thicknesses for the Imposed Desiccated Zones and Shorthand Notation for the Different Scenarios
 Figure 3.23. Case 10t-45d Simulated Moisture Content Distribution for a) Just After the First Imposed
 Figure 2.78. Upper and Lower Thermistor Readings During Desiccation (<576 hr) and Rewetting Period (>576 hr) for Experiment I
 Figure 2.100. Relative Humidity (%) as a Function of Time for H-4, H-7, H-8, H-10, and H-11 During Rewetting Event for Experiment II. Humidity at probes H-4, -7, and -10 reached 100%
 Figure 2.101. Relative Humidity (%) as a Function of Time for H-13, H-14, and H-15 During Rewetting Event for Experiment II
 Figure 3.21. (contd)
 Figure 2.35. Temperature as a Function of Time for Experiment IV-d-1
 Figure 3.48. Plan (mid-screen depth) and Cross Sectional Views of the Pressure Gradients for 100/100 cfm Injection/Extraction Flow Rates. Injection well is at –6 m and the extraction well is at 6 m.
 Figure 2.69. Relative Humidity as a Function of Time for Experiment VIII-r-2
 Figure 2.68. Relative Humidity as a Function of Time for Experiment VIII-r-1
 Figure 2.60. Temperature as a Function of Time for Experiment V-d-2
 Figure 2.59. Relative Humidity as a Function of Time for Experiment V-d-2
 Figure 2.94. Water Potential as a Function of Time for HDU-13, HDU-14, and HDU-15 (Experiment II)
 Figure 2.83. Location of HDUs and Thermistors/Humidity Probes for Experiment II


