scispace - formally typeset
Search or ask a question
Posted ContentDOI

Local earthquake tomography at the Los Humeros geothermal field, Mexico

About: The article was published on 2020-03-09 and is currently open access. It has received 6 citations till now. The article focuses on the topics: Geothermal gradient.

Summary (4 min read)

1. Introduction

  • Los Humeros Volcanic Complex (LHVC) is a superhot geothermal system located at the eastern edge of the Trans-Mexican Volcanic Belt (TMVB), a volcanically active region favorable for geothermal energy exploitation.
  • Classical tomographic results are strongly influenced by the inversion grid or node spacing choice, and hence, its adequate selection is fundamental to retrieve the main features of the subsurface for reliable interpretation.
  • The authors image the 3-D Vp and Vp/Vs structures, along with the seismicity distribution at Los Humeros geothermal field.
  • In section 5, the authors compute and average the 3-D tomography of several parametrized models using the minimum 1-D velocity model as initial input.

2. Geologic and Tectonic Setting

  • A second set of faults parting from the main system runs N-S, NE-SW, and E-W. Both sets disappear at the surface when approaching Los Potreros caldera rim .
  • Here, the authors briefly describe the lithologies found in the four major groups.
  • The lower portion of the basement, also called the Teziultlán Massif, is mainly composed of old intrusive igneous and metamorphic rocks (Paleozoic granites, greenschists, and granodiorites) (Quezadas-Flores, 1961; Viniegra, 1965; Yáñez & García, 1982).
  • This unit is characterized primarily by eruptive events which resulted in the formation of Los Humeros and Los Potreros calderas (Carrasco-Núñez & Branney, 2005; Carrasco-Núñez et al., 2012; Ferriz & Mahood, 2009; Norini et al., 2019).

3.1. Seismic Network

  • From September 2017 to September 2018, the authors deployed and maintained a temporary seismic network comprising 25 three-component broadband (Trillium Compact 120s) and 20 three-component short-period (Mark L-4C-3D) sensors recording continuous seismic data at sampling rates of 200 and 100 Hz, respectively (Toledo et al., 2019).
  • The array consisted of two complementary subnetworks each configured to characterize shallow and deeper structures using different seismic processing techniques .
  • A denser (∼1.6–2 km interstation distance) pseudorhomboidal array was located mainly in the inner Los Potreros caldera where previous studies have identified the occurrence of local seismicity (Gutierrez-Negrin & Quijano-Leon, 2004; TOLEDO ET AL.
  • This subnetwork was primarily designed for local microseismicity retrieval (Gaucher et al., 2019), local earthquake tomography, beamforming of ambient noise (Löer et al., 2020), time-reverse imaging (Werner & Saenger, 2018), and autocorrelation techniques (Verdel et al., 2019).

3.2. Local Earthquake Detection

  • The authors focused the event detection mainly on Los Potreros caldera (Gaucher et al., 2019) using Python tools based on the ObsPy library (Beyreuther et al., 2010).
  • The authors calibrated a recursive short-time-average through long-time-average (STA/LTA) detection algorithm (Trnkoczy, 2012; Withers et al., 1998) on several days of the recently acquired seismic data set (2017–2018) and on a set of local seismic events recorded between 2005 and 2006 by the permanent network operated by the CFE (Lermo et al., 2008).
  • The optimum parameters selected were a combination of bandpass filter between 10 and 30 Hz, STA and LTA windows of 0.2 and 2 s, respectively, and on and off trigger thresholds of the computed STA/LTA function at 3.5 and 1.0, respectively.
  • The authors reviewed each triggered detection and manually picked P and S wave arrivals of local events and their associated empirical uncertainty range using the Python Obspyck tool (Megies, 2016).
  • After picking P and S phases, these earthquakes were located using an oct-tree search (Lomax et al., 2000, 2009) in a homogeneous 3-D volume TOLEDO ET AL.

4. The 1-D Velocity Model

  • The authors use the retrieved travel time data from the filtered catalog (333 events with 2,146 P wave and 2,146 S wave picks) as input for a joint inversion to determine the so-called minimum 1-D Vp and Vs models and the hypocenter relocations using the code Velest (Kissling et al., 1994).
  • This procedure uses regularization parameters (damping factors) to tackle instabilities due to data uncertainties (Levenberg, 1944; Marquardt, 1963) and continues until a maximum number of iterations is reached.
  • The following layers are then defined roughly every 0.5 km at shallow depths and progressively increase to 1 and 2 km for deeper levels.
  • Finally, the authors manually select the model with the lowest misfit value that best coincides with the main trend of most frequent velocity values as the minimum 1-D velocity model.
  • The Vp model proposed by Lermo et al. (2008) was derived using a seismic reflection profile and reaches an approximate depth of −0.5 km, below which a default value of 5.18 km/s is assigned.

5. The 3-D Seismic Tomography

  • After selecting the reference 1-D velocity model and hypocenter locations, the authors used the 3-D travel time inversion code SIMUL2000 (Eberhart-Phillips, 1990; Eberhart-Phillips & Michael, 1998; Evans et al., 1994; Thurber, 1983) to estimate the 3-D velocity structure of the geothermal field.
  • Forward calculations are computed using a pseudo bending method (Uhrhammer, 1987), and inversions are performed using an iterative damped least squares scheme.
  • The software SIMUL2000 allows for the simultaneous inversion of Vp and Vp/Vs ratio instead of Vs to account for the generally lower resolution of Vs models due to larger uncertainties of S wave arrival determination, most of them being hampered by the coda of the P wave (Thurber, 1993; Thurber & Eberhart-Phillips, 1999).
  • Inversions in this section are computed using the minimum 1-D Vp model and a homogeneous Vp/Vs of 1.71 obtained from a Wadati diagram analysis of the stacked events.

5.1. Model Parametrization

  • An appropriate model parametrization is suggested by Evans et al. (1994) and Husen et al. (2000, 2003) as that with the finest possible node spacing, which allows inversions without strong derivative weighted sum (DWS) heterogeneities.
  • Accounting for known subsurface features could lead to a too fine model node spacing which in turn could result in lower-resolution values and sparse imaging.
  • Iterations are performed through finer grids using a coarse model output as input for a new inversion with a finer grid.
  • Taking into account the raypath configuration, the authors chose an initial lateral parametrization of 1 × 1 km2 and 0.5 km internode spacing with depth within Los Humeros caldera region .
  • DWS values are, as expected, larger within the regions above the seismic clusters (higher ray density) and extend to 0 to−1 km depth.

5.3. Model Quality and Uncertainty

  • An adequate quality assessment of the solution is typically carried out to validate inversion performance.
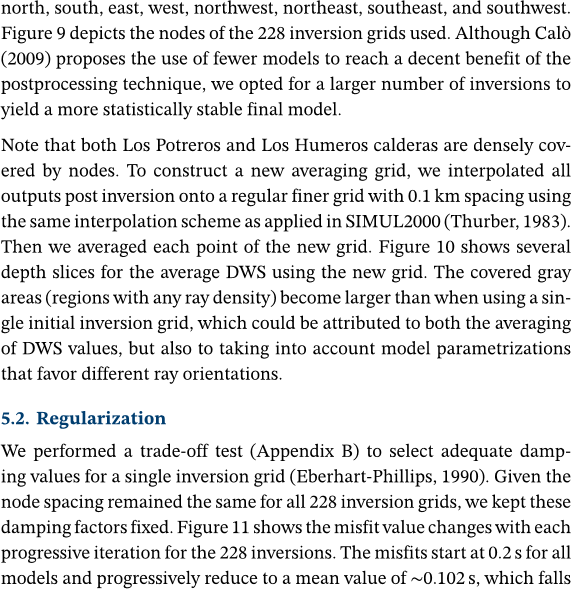
  • Figure 12 shows the recovered velocity anomalies for Vp and Vp/Vs across several depth slices.
  • These areas coincide with those of lower spread and high RDE values in Figures D1 and C1, respectively.
  • Overall, the uneven seismicity distribution (raypath configuration) marks a very limited area (shallow north central portion of Los Potreros caldera) of good recovery.
  • It is worth noting that a single inversion using the same grid configuration as the one used to produce the synthetic model perturbations is able to retrieve these anomalies accurately.

6.2.1. Main Results

  • The final earthquake catalog was obtained by averaging the coordinates and origin times of the output catalogs of each inversion.
  • The standard deviation of each component was used to quantify the location uncertainties which were on average 131 m, 127 m, 214 m, and 0.027 s for x, y, z, and origin time, respectively.
  • In a similar manner, Cluster C2 reflects the position of Los Humeros fault further south.
  • Given their vicinity to injection wells , most of them could probably be induced/triggered events.
  • At the surface, this region coincides with the area between the E-W trending Las Papas and Las Viboras faults but does not seem directly associated with any geothermal wells.

6.3.1. Main Results

  • The authors results provide new detailed insights into the 3-D P velocity structure of Los Humeros geothermal field.
  • Nevertheless, the authors show absolute velocity values with contour lines in the cross sections to ease interpretation.
  • If the authors observe the Vp variations in cross sections , the high-velocity anomaly is located mostly toward the east of Los Humeros normal fault.
  • This feature barely reaches the limits of the imaging capabilities of their data set and must therefore be interpreted with caution.

6.3.2. Discussion

  • Some of the velocity anomalies at −2.6 km depth accurately follow the surface geology .
  • To determine possible unit boundaries, the authors marked the positions of several neighboring interpreted wells (Carrasco-Núñez, López-Martínez, et al., 2017) in the cross sections shown in Figure 15.
  • The caldera stage (mainly ignimbrites) lower boundary was interpreted at around −2.0 km depth with average Vp of 2.8 km/s. Laboratory measurements range between ∼1.8–3.5 km/s for rocks found in this unit.

6.4.1. Main Results

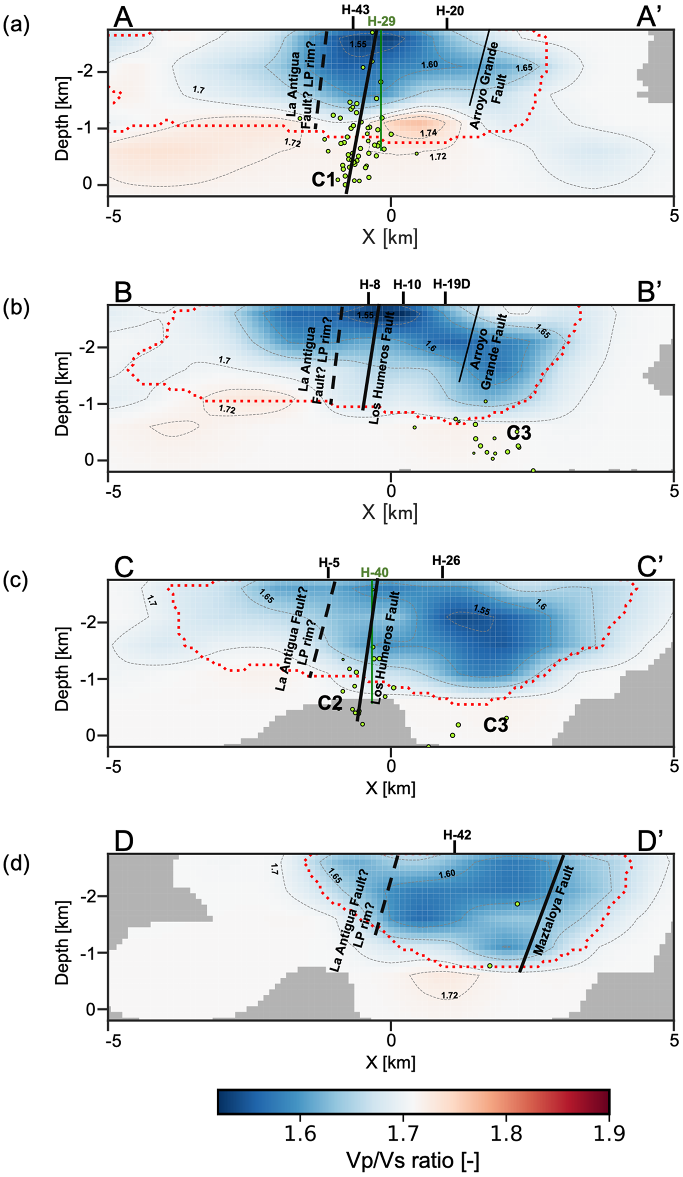
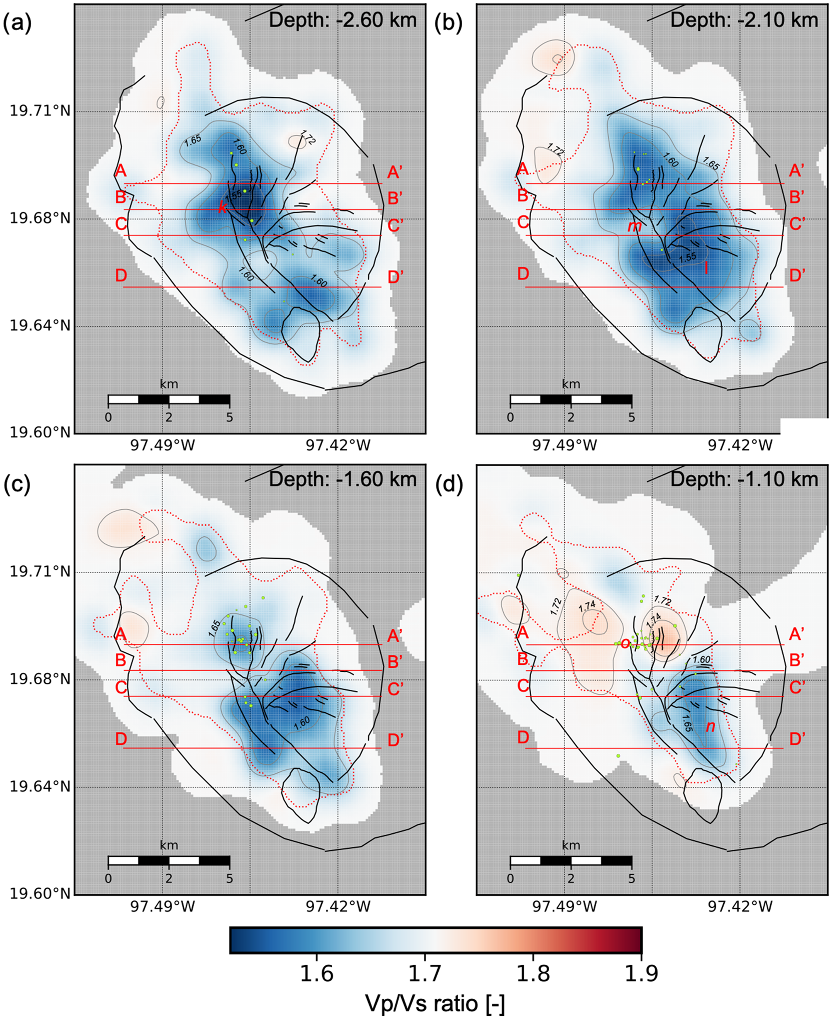
  • Average Vp/Vs values varied between 1.50 and 1.77 throughout the studied region , with standard deviations in the order of ±0.02 .
  • This behavior is also seen in the cross sections of Figure 17, where in many cases the anomaly extends at depth mostly toward the east of Los Humeros fault.
  • Further in depth, the high Vp/Vs anomalies could hint at regions with increased liquid content (Gassmann, 1951).
  • West of Los Humeros fault zone, the second high Vp/Vs anomaly coincides with generally lower Vp values (3.2–3.4 km/s), which could be an indication of rocks, namely, the andesites, influenced by the presence of liquid.
  • These areas could potentially be considered for further exploration and exploitation of the geothermal field.

7. Conclusions

  • A new seismological analysis using a dense temporary seismic network was undertaken at Los Humeros geothermal field.
  • The results were then carefully integrated with new geophysical, geological, and petrophysical data for interpretation.
  • The statistical approach reduces the potential smearing resulting from selecting model parametrizations that do not align with anomaly location and orientations, which are in many cases unknown prior to computing a tomography.
  • Urbani et al. (2020) suggest that intrusions in the region are the result of the inflation of the magma chamber at depth and may represent locations of local heat source(s).
  • The low Vp/Vs in combination with low Vp values could indicate gas bearing regions (Gassmann, 1951; Husen et al.

Did you find this useful? Give us your feedback

Figures (17)

Content maybe subject to copyright    Report

Local Earthquake Tomography at Los Humeros
Geothermal Field (Mexico)
T. Toledo
1,2
, E. Gaucher
3
, P. Jousset
1
, A. Jentsch
1
, C. Haberland
1
, H. Maurer
4
,
C. Krawczyk
1,2
, M. Calò
5
, and A. Figueroa
6
1
GFZ German Research Center for Geosciences, Potsdam, Germany,
2
Faculty VI Planning Building Environment:
Institute of Applied Geosciences, TU Berlin, Berlin, Germany ,
3
Institute for Applied Geosciences: Geothermal Energy
and Reservoir Technology, Karlsruhe Institute of Technology (KIT), Karlsruhe, Germany,
4
Institute of Geophysics:
Applied and Environmental Geophysics, ETH Zurich, Zurich, Switzerland,
5
Instituto de Geofísica, UNAM, Mexico City,
Mexico,
6
Instituto de investigaciones en Ciencias de la Tierra, Universidad Michoacana de San Nicolás de Hidalgo,
Morelia, Mexico
Abstract A passive seismic experiment using 25 broadband and 20 short-period stations was
conducted between September 2017 and September 2018 at Los Humeros geothermal field, an important
natural laboratory for superhot geothermal systems in Mexico. From the recorded local seismicity, we
derive a minimum 1-D velocity model and obtain 3-D Vp and Vp/Vs structures of Los Humeros. We
improved the classical local earthquake tomography by using a postprocessing statistical approach. Several
inversions were computed and averaged to reduce artifacts introduced by the model parametrization
and to increase the resolution of the investigated region. Finally, the resulting Vp and Vp/Vs structures
and associated seismicity were integrated with newly acquired geophysical and petrophysical data for
comprehensive interpretation. The recorded seismicity is mainly grouped in three clusters, two of which
seem directly related to exploitation activities. By combining new laboratory measurements and existing
well data with our Vp model, we estimate possible geological unit boundaries. One large intrusion-like
body in the Vp model, together with neighboring high Vp/Vs anomalies, hints at a region of active
resurgence or uplift due to the intrusion of new magma at the northern portion of the geothermal field. We
interpret high Vp/Vs features as fluid bearing regions potentially favorable for further geothermal
exploitation. Deep reaching permeable faults cutting the reservoir unit could explain fluid flow from a
deeper local heat source in the area.
1. Introduction
Los Humeros Volcanic Complex (LHVC) is a superhot geothermal system located at the eastern edge of
the Trans-Mexican Volcanic Belt (TMVB), a volcanically active region favorable for geothermal energy
exploitation. It is one of the oldest producing fields in the region, with more than 60 wells drilled up
to 3 km deep since the early 1980s (Arellano et al., 2003; Cedillo-Rodríguez, 1999; Gutierrez-Negrin &
Izquierdo-Montalvo, 2010; Rocha-López et al., 2010). Currently, it has an installed capacity of 95 MW elec-
tric power and is administered by the Comisión Federal de Electricidad (CFE) (Romo-Jones et al., 2018).
Temperatures as high as 400
C have been measured in several producing wells at 2.5 km depth. However,
geothermal fluids at these temperatures are presently not being exploited. Despite the large num-
ber of studies on the geochemical (e.g., Martinez & Alibert, 1994), geological (e.g., Carrasco-Núñez,
Hernández, et al., 2017; Carrasco-Núñez, López-Martínez, et al., 2017), structural (e.g., Norini et al., 2015),
and geothermal (e.g., Gutierrez-Negrin & Izquierdo-Montalvo, 2010) properties of the reservoir, a solid
understanding of the conditions and underground structures at depth is still rather sparse. Only a few
deep probing geophysical studies (resistivity 2-D profiles and seismic surveys) in recent years have provided
notions of the local stress field and structures of the geothermal field (Arzate et al., 2018; Gutierrez-Negrin
& Quijano-Leon, 2004; Lermo et al., 2001, 2016, 2008; Norini et al., 2019; Urban & Lermo, 2013).
One objective of this study is to investigate the deeper structures of the geothermal system and to locate
and better understand the deep superhot fluids for their exploitation. Passive seismic methods are to this
purpose widely exploited in geothermal prospecting (e.g., Calò & Dorbath, 2013; Jousset et al., 2011; Muksin
et al., 2013). Seismic properties such as the compressional P (Vp) and shear S (Vs) wave velocities, and
RESEARCH ARTICLE
10.1029/2020JB020390
Key Points:
High-quality earthquake data were
collected to image the Vp and
Vp/Vs models for the first time
at Los Humeros geothermal field
(Mexico)
Inversions were performed by
extending the classical earthquake
tomography using a postprocessing
statistical approach
Geological unit boundaries and
fluid and gas bearing zones were
interpreted considering new
geological, geophysical, and
petrophysical data
Correspondence to:
T. Toledo,
taniat@gfz-potsdam.de
Citation:
Toledo, T., Gaucher, E., Jousset, P.,
Jentsch, A., Haberland, C.,
Maurer, H., et al. (2020). Local
earthquake tomography at Los
Humeros geothermal field (Mexico).
Journal of Geophysical Research:
Solid Earth, 125, e2020JB020390.
https://doi.org/10.1029/2020JB020390
Received 13 JUN 2020
Accepted 26 OCT 2020
Accepted article online 30 NOV 2020
The copyright line for this article was
changed on 18 DEC 2020 after original
online publication.
©2020. The Authors.
This is an open access article under the
terms of the Creative Commons
Attribution License, which permits
use, distribution and reproduction in
any medium, provided the original
work is properly cited.
TOLEDO ET AL. 1of29

Journal of Geophysical Research: Solid Earth 10.1029/2020JB020390
the Vp/Vs ratio structures have proven reliable tools to describe lithologies and possible variations due to
changes in fluid composition, rock porosity, and temperature (e.g., Gritto & Jarpe, 2014; Husen et al., 2004;
Ito et al., 1979; Mavko & Mukerji, 1995). These are key features in geothermal exploration and monitoring.
One conventional approach to obtain the seismic properties of a target area is the 3-D tomographic inversion
of P and S wave arrival times from local earthquakes, as observed in records of seismometers deployed in
the area of interest. The 3-D velocity structure is typically obtained through a joint inversion of hypocenter
locations and velocity structures using an a priori parameterized 3-D grid model of the subsurface. Classical
tomographic results are strongly influenced by the inversion grid or node spacing choice, and hence, its ade-
quate selection is fundamental to retrieve the main features of the subsurface for reliable interpretation. A
too fine model could, for example, lead to poor-resolution values and/or artifacts such as grid oscillations,
whereas a too coarse model (especially a coarse fixed grid) could overlook smaller underground features.
In addition, significant smearing can be introduced when the chosen grid does not follow the orientation of
the main anomalies. In this work, we extend the conventional tomographic method of a single fixed model
grid by using a postprocessing statistical approach. We compute and average several inversions using differ-
ent model parametrizations to achieve higher spatial accuracy, reduce the effects of poor parametrization
selection, and overall increase model resolution.
In this study, we image the 3-D Vp and Vp/Vs structures, along with the seismicity distribution at Los
Humeros geothermal field. In the first part of this study, we compile information on the geological and struc-
tural setting of Los Humeros area. Later, we describe the passive seismic experiment and the data processing
workflow followed to detect and locate the local seismic events. We use the retrieved earthquake catalog
to derive a new so-called minimum 1-D velocity model in section 4. In section 5, we compute and aver-
age the 3-D tomography of several parametrized models using the minimum 1-D velocity model as initial
input. Finally, section 6 proposes a first interpretation of the obtained results in relation to existing geologi-
cal information and newly acquired petrophysical, geochemical, and geophysical data (Bär & Weydt, 2019;
Benediktsdóttir et al., 2019; Jentsch et al., 2020; Lucci et al., 2020; Urbani et al., 2020).
2. Geologic and Tectonic Setting
LHVC is a Quaternary geological complex constituted by two nested calderas: the older (ca. 460 kyr) outer
18–20 km wide Los Humeros caldera and the younger (70 kyr) subordinate 5–8 km wide Los Potreros caldera
(Carrasco-Núñez, Hernández, et al., 2017; Carrasco-Núñez, López-Martínez, et al., 2017; Carrasco-Núñez
et al., 2018; Calcagno et al., 2018), where most of the injection and geothermal production activities take
place (Figure 1). An extensive fault network crosses the main production zone of the geothermal field
and is responsible for secondary permeability in the reservoir. Several faults (e.g., Los Humeros fault and
the Loma Blanca fault) favor fluid flow and present strong hydrothermal alteration at the surface (Norini
et al., 2015, 2019). The main fault system runs around 8 km in a NNW-SSE direction and includes the
Maztaloya fault and Los Humeros fault. A second set of faults parting from the main system runs N-S,
NE-SW, and E-W. Both sets disappear at the surface when approaching Los Potreros caldera rim (Figure 1).
From a geological perspective, Los Humeros geothermal field can be divided into four distinct groups:
(1) regional metasedimentary basement, (2) precaldera, (3) caldera, and (4) postcaldera volcanic phases,
which can be subdivided into nine local lithostratigraphic units (Carrasco-Núñez, López-Martínez, et al.,
2017; Calcagno et al., 2018). Here, we briefly describe the lithologies found in the four major groups. The
lower portion of the basement, also called the Teziultlán Massif, is mainly composed of old intrusive igneous
and metamorphic rocks (Paleozoic granites, greenschists, and granodiorites) (Quezadas-Flores, 1961;
Viniegra, 1965; Yáñez & García, 1982). These rocks are covered by an up to 3 km thick Mesozoic sedimen-
tary basement mostly constituted of limestones, with some silts and shales. The basement is overlain by
the precaldera group (10.5–0.155 Ma) mainly composed of andesitic, dacitic, and to a minor extent, basaltic
lavas also known as Teziutlán andesites. The Teziutlán volcanic unit hosts the active geothermal reservoir
and has a thickness larger than 1,500 m in some of the geothermal wells within LHVC (Arellano et al., 2003;
Carrasco-Núñez, Hernández, et al., 2017; Carrasco-Núñez, López-Martínez, et al., 2017; Cedillo-Rodríguez,
1997, 1999; Ferriz & Mahood, 2009; Gutierrez-Negrin & Izquierdo-Montalvo, 2010; Lorenzo-Pulido, 2008;
Norini et al., 2019; Yáñez & García, 1982). The basalts and andesites are sealed above by low-permeability
Quaternary ignimbrites of variable thickness belonging to the caldera stage (Arellano et al., 2003;
Cedillo-Rodríguez, 1997, 1999; Gutierrez-Negrin & Izquierdo-Montalvo, 2010; Lorenzo-Pulido, 2008;
TOLEDO ET AL. 2of29

Journal of Geophysical Research: Solid Earth 10.1029/2020JB020390
Figure 1. (a) Surface geology, (b) main structures, and well locations at LHVC (modified from Carrasco-Núñez, Hernández, et al., 2017; Norini et al., 2015).
(c) Locations of the Trans-Mexican Volcanic Belt (TMVB) and LHVC (red triangle).
Norini et al., 2019). This unit is characterized primarily by eruptive events which resulted in the formation
of Los Humeros and Los Potreros calderas (Carrasco-Núñez & Branney, 2005; Carrasco-Núñez et al., 2012;
Ferriz & Mahood, 2009; Norini et al., 2019). The postcaldera stage (0.05 < 0.003 Ma) was influenced by
different intracaldera eruptive phases (effusive and explosive). Rhyodacitic, andesitic, and basaltic lavas and
pyroclastic material (Carrasco-Núñez et al., 2018) were produced by various monogenetic volcanic centers
which are scattered between Los Potreros and Los Humeros caldera rims (Norini et al., 2015, 2019). During
that time, another significant eruption took place which resulted in the 1.7 km oval shaped Xalapazco crater
in the south of the complex (Carrasco-Núñez et al., 2018).
3. Seismic Monitoring and Data Processing
3.1. Seismic Network
From September 2017 to September 2018, we deployed and maintained a temporary seismic network com-
prising 25 three-component broadband (Trillium Compact 120s) and 20 three-component short-period
(Mark L-4C-3D) sensors recording continuous seismic data at sampling rates of 200 and 100 Hz, respectively
(Toledo et al., 2019). The array consisted of two complementary subnetworks each configured to characterize
shallow and deeper structures using different seismic processing techniques (Figure 2). A denser (1.6–2 km
interstation distance) pseudorhomboidal array was located mainly in the inner Los Potreros caldera where
previous studies have identified the occurrence of local seismicity (Gutierrez-Negrin & Quijano-Leon, 2004;
TOLEDO ET AL. 3of29

Journal of Geophysical Research: Solid Earth 10.1029/2020JB020390
Figure 2. Topographic map and temporary seismic network at Los Humeros geothermal field. Blue and red triangles
mark the positions of three component short-period (Mark L-4C-3D) and three-component broadband (Trillium
Compact 120s) sensors, respectively. The reference station for the 1-D inversions (also a three-component broadband
Trillium Compact 120s sensor) is marked as a red circle. Several identified and inferred structures are delineated in
black (modified from Carrasco-Núñez, Hernández, et al., 2017; Norini et al., 2015).
Lermo et al., 2001, 2016, 2008; Urban & Lermo, 2013) and where most of the producing and injecting wells
are located. This subnetwork was primarily designed for local microseismicity retrieval (Gaucher et al.,
2019), local earthquake tomography, beamforming of ambient noise (Löer et al., 2020), time-reverse imaging
(Werner & Saenger, 2018), and autocorrelation techniques (Verdel et al., 2019). The second much sparser
network (5–10 km interstation distance) was placed around the outer Los Humeros caldera and was mainly
intended for imaging deeper large-scale structures with techniques such as ambient noise tomography
(Granados et al., 2020; Martins et al., 2020), among others.
3.2. Local Earthquake Detection
We focused the event detection mainly on Los Potreros caldera (Gaucher et al., 2019) using Python tools
based on the ObsPy library (Beyreuther et al., 2010). We calibrated a recursive short-time-average through
long-time-average (STA/LTA) detection algorithm (Trnkoczy, 2012; Withers et al., 1998) on several days of
the recently acquired seismic data set (2017–2018) and on a set of local seismic events recorded between 2005
and 2006 by the permanent network operated by the CFE (Lermo et al., 2008). We exhaustively tested the
detection performance through several days of the recent seismic database using a wide range of parameter
combinations. The optimum parameters selected were a combination of bandpass filter between 10 and 30
Hz, STA and LTA windows of 0.2 and 2 s, respectively, and on and off trigger thresholds of the computed
STA/LTA function at 3.5 and 1.0, respectively. To account for the P and S wave arrivals, the STA/LTA function
was computed from a single amplitude trace determined by the square root of the sum of the three single
component squared traces for each station. Finally, a detection was declared as such when the triggering
window of at least five stations from the dense subnetwork coincided in time (Trnkoczy, 2012; Withers
et al., 1998). We reviewed each triggered detection and manually picked P and S wave arrivals of local events
and their associated empirical uncertainty range using the Python Obspyck tool (Megies, 2016).
From a total of 1,586 detections, 488 were identified as local events. After picking P and S phases, these
earthquakes were located using an oct-tree search (Lomax et al., 2000, 2009) in a homogeneous 3-D volume
TOLEDO ET AL. 4of29

Journal of Geophysical Research: Solid Earth 10.1029/2020JB020390
Figure 3. Distribution of the detected local earthquakes after a nonlinear localization in a homogeneous 3-D volume with a P wave velocity of 3.5 km/s and a
Vp/Vs ratio of 1.73. Triangles mark the station positions, and dark solid lines indicate structures inferred at the surface. Red stars mark the positions of
three injection wells. C1, C2, a nd C3 indicate the positions of three main seismic clusters. Depths are defined relative to sea level.
with a P wave velocity of 3.5 km/s and a Vp/Vs ratio of 1.73 (Figure 3). Later, we reselected the seismic events
with a greatest angle without observation (GAP) of less than 180
and at least three P and three S wave
arrivals (333 events in total) for the calculation of a minimum 1-D velocity model and their relocation. The
recorded seismicity is mostly located below the dense array within Los Potreros caldera and mainly grouped
into three distinctive clusters, marked as C1, C2, and C3 in Figure 3.
4. The 1-D Velocity Model
We use the retrieved travel time data from the filtered catalog (333 events with 2,146 P wave and 2,146 S
wave picks) as input for a joint inversion to determine the so-called minimum 1-D Vp and Vs models and
the hypocenter relocations using the code Velest (Kissling et al., 1994). The code Velest iteratively com-
putes forward modeled data (predicted travel times), using a ray tracer in an initial model (1-D velocity
model, hypocenter locations, and station corrections), compares the synthetic data to the observed data
set, and updates the model such that the RMS (root-mean-square) misfit between the two is minimized
(Tarantola, 2005). This procedure uses regularization parameters (damping factors) to tackle instabilities
due to data uncertainties (Levenberg, 1944; Marquardt, 1963) and continues until a maximum number of
iterations is reached.
The estimation of a minimum 1-D model consists of a trial and error process in which typically a broad
range of plausible initial models is tested to ensure covering as many potential solutions as possible and
select the best fitting model. This procedure is necessary because the inversions are based on linearization
and thus strongly depend on the initial model. In this work, we performed the inversion of 10,648 initial
models with varying P wave velocities at the surface, vertical velocity gradients, and Vp/Vs ratios (thus also
varying Vs models) over five iterations. The software Velest allows tracing rays to the true station elevations.
However this option poses the limitation of locating all stations within the first layer. With this in mind,
we set the uppermost layer thickness to more than 1 km, which corresponds to the approximate elevation
difference between the highest and lowest recording stations. The following layers are then defined roughly
every 0.5 km at shallow depths and progressively increase to 1 and 2 k m for deeper levels. The depth intervals
were chosen taking into account well data interpretation (Norini et al., 2015, 2019) and exhaustive testing.
TOLEDO ET AL. 5of29

Citations
More filters
Journal ArticleDOI
TL;DR: Weydt et al. as discussed by the authors developed a new workflow to overcome the gap of knowledge of the reservoir properties, which is used for the interpretation of geophysical data and the parameterization of numerical models and thus are the basis for economic reservoir assessment.
Abstract: . Petrophysical and mechanical rock properties are key parameters for the characterization of the deep subsurface in different disciplines such as geothermal heat extraction, petroleum reservoir engineering or mining. They are commonly used for the interpretation of geophysical data and the parameterization of numerical models and thus are the basis for economic reservoir assessment. However, detailed information regarding petrophysical and mechanical rock properties for each relevant target horizon is often scarce, inconsistent or distributed over multiple publications. Therefore, subsurface models are often populated with generalized or assumed values resulting in high uncertainties. Furthermore, diagenetic, metamorphic and hydrothermal processes significantly affect the physiochemical and mechanical properties often leading to high geological variability. A sound understanding of the controlling factors is needed to identify statistical and causal relationships between the properties as a basis for a profound reservoir assessment and modeling. Within the scope of the GEMex project (EU H2020, grant agreement no. 727550), which aims to develop new transferable exploration and exploitation approaches for enhanced and super-hot unconventional geothermal systems, a new workflow was applied to overcome the gap of knowledge of the reservoir properties. Two caldera complexes located in the northeastern Trans-Mexican Volcanic Belt – the Acoculco and Los Humeros caldera – were selected as demonstration sites. The workflow starts with outcrop analog and reservoir core sample studies in order to define and characterize the properties of all key units from the basement to the cap rock as well as their mineralogy and geochemistry. This allows the identification of geological heterogeneities on different scales (outcrop analysis, representative rock samples, thin sections and chemical analysis) enabling a profound reservoir property prediction. More than 300 rock samples were taken from representative outcrops inside the Los Humeros and Acoculco calderas and the surrounding areas and from exhumed “fossil systems” in Las Minas and Zacatlan. Additionally, 66 core samples from 16 wells of the Los Humeros geothermal field and 8 core samples from well EAC1 of the Acoculco geothermal field were collected. Samples were analyzed for particle and bulk density, porosity, permeability, thermal conductivity, thermal diffusivity, and heat capacity, as well as ultrasonic wave velocities, magnetic susceptibility and electric resistivity. Afterwards, destructive rock mechanical tests (point load tests, uniaxial and triaxial tests) were conducted to determine tensile strength, uniaxial compressive strength, Young's modulus, Poisson's ratio, the bulk modulus, the shear modulus, fracture toughness, cohesion and the friction angle. In addition, X-ray diffraction (XRD) and X-ray fluorescence (XRF) analyses were performed on 137 samples to provide information about the mineral assemblage, bulk geochemistry and the intensity of hydrothermal alteration. An extensive rock property database was created (Weydt et al., 2020; https://doi.org/10.25534/tudatalib-201.10 ), comprising 34 parameters determined on more than 2160 plugs. More than 31 000 data entries were compiled covering volcanic, sedimentary, metamorphic and igneous rocks from different ages (Jurassic to Holocene), thus facilitating a wide field of applications regarding resource assessment, modeling and statistical analyses.

20 citations

Journal ArticleDOI
TL;DR: Löer et al. as mentioned in this paper presented a 1D shear-velocity model for Los Humeros geothermal field (Mexico) obtained from three-component beamforming of ambient seismic noise, imaging for the first time the bottom of the sedimentary basement ∼5 km below the volcanic caldera, as well as the brittle-ductile transition at ∼ 10 km depth.
Abstract: Cite this article as Löer, K., T. Toledo, G. Norini, X. Zhang, A. Curtis, and E. H. Saenger (2020). Imaging the Deep Structures of Los Humeros Geothermal Field, Mexico, Using Three-Component Seismic Noise Beamforming, Seismol. Res. Lett. 91, 3269–3277, doi: 10.1785/ 0220200022. Supplemental Material We present a 1D shear-velocity model for Los Humeros geothermal field (Mexico) obtained from three-component beamforming of ambient seismic noise, imaging for the first time the bottom of the sedimentary basement ∼5 km below the volcanic caldera, as well as the brittle-ductile transition at ∼ 10 km depth. Rayleigh-wave dispersion curves are extracted from ambient seismic noise measurements and inverted using a Markov chain Monte Carlo scheme. The resulting probability density function provides the shear-velocity distribution down to 15 km depth, hence, much deeper than other techniques applied in the area. In the upper 4 km, our model conforms to a profile from local seismicity analysis and matches geological structure inferred from well logs, which validates the methodology. Complementing information fromwell logs and outcrops at the near surface, discontinuities in the seismic profile can be linked to geological transitions allowing us to infer structural information of the deeper subsurface. By constraining the extent of rocks with brittle behavior and permeability conditions at greater depths, our results are of paramount importance for the future exploitation of the reservoir and provide a basis for the geological and thermodynamic modeling of active superhot geothermal systems, in general. Introduction Los Humeros volcanic complex (LHVC; Fig. 1), located in the eastern part of the Trans-Mexican volcanic belt (TMVB), hosts a conventional geothermal field (Ferrari et al., 2012; GutiérrezNegrín, 2019). On-going hydrothermal activity makes the LHVC a favorable area for geothermal exploitation, and a geothermal power plant has been operating since the 1990s. The LHVC has been identified as an important natural laboratory for the development of general models of superhot geothermal systems (SHGSs) in volcanic calderas (e.g., Jolie et al., 2018). Although extensive geological field studies and well log analyses have provided many constraints on the near-surface geology of the caldera complex and conventional geothermal reservoir, conditions at depths greater than 2–3 km are largely unknown and currently being studied intensively (Jolie et al., 2018). It is assumed that superhot fluids could exist in the carbonate rock basement underlying the caldera (Jolie et al., 2018). These rocks might exhibit secondary permeability related to the damage zone of active resurgence faults and inherited pervasive basement structures (Lorenzo-Pulido, 2008; Rocha-López et al., 2010; Norini et al., 2015, 2019; Jolie et al., 2018). The maximum depth of these brittle structures is defined by the brittle-ductile (BD) transition zone, which thus plays an important role in geothermal exploration because upper crustal faults and fractures behave as hydraulic channels for the circulation of geothermal fluids (e.g., Ranalli and Rybach, 2005). In SHGSs that exhibit a positive thermal anomaly, the depth of the BD transition may differ from areas with a normal thermal gradient, as rocks become progressively more ductile with increasing temperature. Thus, a positive 1. Department of Civil and Environmental Engineering, Bochum University of Applied Sciences, Bochum, Germany; 2. Now at Department of Geology and Geophysics, University of Aberdeen, Aberdeen, United Kingdom; 3. German Research Centre for Geosciences GFZ, Section 4.8 Geoenergy, Section 2.2 Geophysical Deep Sounding, Potsdam, Germany; 4. Istituto di Geologia Ambientale e Geoingegneria, Consiglio Nazionale delle Ricerche, Area della Ricerca CNR—ARM3, Milan, Italy; 5. School of Geosciences, Grant Institute, University of Edinburgh, Edinburgh, United Kingdom; 6. Institut für Geophysik, ETH Zürich, Zürich, Switzerland; 7. Institut für Geologie, Mineralogie und Geophysik, Ruhr-Universität Bochum, Bochum, Germany; 8. Fraunhofer-Einrichtung für Energieinfrastruktur und Geothermie IEG, Bochum, Germany *Corresponding author: katrin.loeer@hs-bochum.de; katrin.loer@abdn.ac.uk © Seismological Society of America Volume 91 • Number 6 • November 2020 • www.srl-online.org Seismological Research Letters 3269 Downloaded from http://pubs.geoscienceworld.org/ssa/srl/article-pdf/91/6/3269/5176463/srl-2020022.1.pdf by University of Edinburgh user on 08 November 2020 thermal anomaly could potentially limit the volume of rocks in which secondary permeability may exist. We use three-component (3C) beamforming to extract structural information from ambient seismic noise. 3C beamforming is an array technique, which, like standard beamforming, not only estimates the dominant propagation direction and wavenumber of a recorded wavefield, but in addition determines the polarization of the wavefield by comparing phase shifts across different components (Riahi et al., 2013). As a result, different wave types can be distinguished and their propagation parameters analyzed separately. This allows us, for example, to estimate wavefield composition and surface-wave anisotropy, which is, however, beyond the scope of this study. Here, we consider fundamental mode Rayleigh waves only and extract dispersion curves from frequency–wavenumber (f-k) histograms; these are inverted for a shear-velocity depth profile using a reversible-jump Markov chain Monte Carlo (rj-McMC) algorithm. Although this algorithm is computationally expensive, it has the advantage of providing uncertainties for the velocity profile by finding the distribution of models that are consistent with data. 3C beamforming does not require impulsive (man-made or natural) seismic sources and is thus cheap, flexible, and applicable also in aseismic areas. Whereas cross-correlation-based ambient noise methods typically rely on month-long recordings, from beamforming, we extract stable dispersion curves from only 1 day of seismic noise data. Depending on the array geometry and seismic noise spectrum, the depth sensitivity of 3C beamforming can exceed that of other seismic methods by several kilometers, as we will show in this study. The analysis of four reflection seismic lines recorded across the LHVC, for example, provided 2D velocity maps and seismic sections down to 6 km at the most (Jousset, Ágústsson, et al., 2019). Ambient noise cross-correlation methods applied in the same area, but using a larger array, produce 3D tomographic Figure 1. (a) Simplified geological map of the Los Humeros volcanic complex (LHVC) and surrounding basement, on a shaded relief. The trace of the A-A′ geological cross section of panel (b) is shown. Triangles denote seismic station locations of the dense broadband (DB) network, circles denote geothermal wells. In the upper-right inset, the location of the LHVC within the TransMexican volcanic belt (TMVB) is indicated. (b) A–A′ schematic geological cross section showing the subsurface geometry of the main structures and stratigraphic units. Trace of the geological cross section is shown in panel (a). Modified from Norini et al. (2019). ENE, east-northeast; LH, Los Humeros caldera ring fault; LHh, inferred flexure plane of the Los Humeros trap-door caldera; LP, Los Potreros caldera ring fault; TF: thrust fault; RF, resurgence fault (red lines); WSW, west-southwest. The color version of this figure is available only in the electronic edition. 3270 Seismological Research Letters www.srl-online.org • Volume 91 • Number 6 • November 2020 Downloaded from http://pubs.geoscienceworld.org/ssa/srl/article-pdf/91/6/3269/5176463/srl-2020022.1.pdf by University of Edinburgh user on 08 November 2020 images down to a maximum of 10 km depth (Granados Chavarria et al., 2020; Martins et al., 2020). In a similar manner, a recent local earthquake tomography study provides information only of the upper 3–4 km (Toledo et al., 2020). We show that 3C beamforming provides information to greater than 10 km depth. In the following, we describe geology and available datasets, introduce both 3C beamforming and the rj-McMC inversion algorithm, and summarize our findings in Los Humeros and their implications for SHGSs, in general. Geology of LHVC The LHVC basement is composed of Mesozoic sedimentary rocks involved in the Late Cretaceous–Eocene compressive orogenic phase that generated the Mexican fold and thrust belt (sedimentary basement unit in Fig. 1) (Fitz-Díaz et al., 2017; references therein). The sedimentary basement rests above the Precambrian–Paleozoic crystalline basement of the Teziutlan Massif unit, made of greenschists, granodiorites, and granites (e.g., Suter, 1987; Suter et al., 1997; Ortuño-Arzate et al., 2003; Ángeles-Moreno, 2012; Fitz-Díaz et al., 2017) (Fig. 1a,b). Since the Eocene, the area underwent a limited extensional tectonic phase, associated with northeast-striking normal faults and the emplacement of Eocene–Miocene granite and granodiorite magmatic intrusions (Fig. 1a). The TMVB volcanic activity occurred from 10.5 to 1.55 Ma with the emplacement of fractured andesites, basaltic lava flows, and few volcaniclastic levels (old volcanic succession unit in Fig. 1) (e.g., Yanez and Garcia, 1982; Ferriz and Mahood, 1984; López-Hernández, 1995; Cedillo-Rodríguez, 1997; Carrasco-Núñez, Hernandez, et al., 2017; Carrasco-Núñez et al., 2018). Volcanic activity resumed ∼700 ka ago with the emplacement of the Pleistocene– Holocene LHVC (LHVC unit in Fig. 1) (e.g., Carrasco-Núñez, Hernandez, et al., 2017; Carrasco-Núñez et al., 2018). This volcanic complex represents a basaltic andesite–rhyolite system of two nested calderas, namely the outer Los Humeros caldera and the inner Los Potreros caldera (Carrasco-Núñez, Hernandez, et al., 2017; Calcagno et al., 2018) (Fig. 1a). The LHVC caldera stage occurred between ∼165 and ∼69 ka and consisted of two major ca

10 citations

Journal ArticleDOI
TL;DR: In this article , the authors share 3D geological models that were constructed at different scales in two Mexican geothermal areas as part of the European-Mexican GEMex project.
Abstract: This paper aims at sharing 3D geological models that were constructed at different scales in two Mexican geothermal areas as part of the European-Mexican GEMex project. The project was devoted to investigate superhot resources in Los Humeros and enhanced geothermal systems in Acoculco, both areas located in eastern Mexico. To build confidence in the resultant datasets and to potentially inform the development of models in similar contexts, the methodology is also described. The models integrate the main geological and geothermal features of the study areas and served as a framework for subsequent calculations and simulations. Preliminary models were based on data available at the beginning of the project, and were updated several times as new geological, geochemical, and geophysical field-data were obtained. The construction of the geomodels was performed in a collaborative and interdisciplinary way, using an existing software, and ultimately enabled a consensus interpretation and representation to be reached by the several disciplinary experts involved.

5 citations

Journal ArticleDOI
TL;DR: In this paper , the authors share 3D geological models that were constructed at different scales in two Mexican geothermal areas as part of the European-Mexican GEMex project.
Abstract: This paper aims at sharing 3D geological models that were constructed at different scales in two Mexican geothermal areas as part of the European-Mexican GEMex project. The project was devoted to investigate superhot resources in Los Humeros and enhanced geothermal systems in Acoculco, both areas located in eastern Mexico. To build confidence in the resultant datasets and to potentially inform the development of models in similar contexts, the methodology is also described. The models integrate the main geological and geothermal features of the study areas and served as a framework for subsequent calculations and simulations. Preliminary models were based on data available at the beginning of the project, and were updated several times as new geological, geochemical, and geophysical field-data were obtained. The construction of the geomodels was performed in a collaborative and interdisciplinary way, using an existing software, and ultimately enabled a consensus interpretation and representation to be reached by the several disciplinary experts involved.

5 citations

Journal ArticleDOI
TL;DR: In this article , the authors used an ambient seismic noise technique referred to as three-component beamforming to detect and characterize faults and fractures at the Los Humeros Geothermal Field (LHGF) in Mexico.
Abstract: Abstract. Faults and fractures are crucial parameters for geothermal systems as they provide secondary permeability allowing fluids to circulate and heat up in the subsurface. In this study, we use an ambient seismic noise technique referred to as three-component (3C) beamforming to detect and characterize faults and fractures at a geothermal field in Mexico. We perform 3C beamforming on ambient noise data collected at the Los Humeros Geothermal Field (LHGF) in Mexico. The LHGF is situated in a complicated geological area, part of a volcanic complex with an active tectonic fault system. Although the LHGF has been exploited for geothermal resources for over 3 decades, the field has yet to be explored at depths greater than 3 km. Consequently, it is currently unknown how deep faults and fractures permeate, and the LHGF has yet to be exploited to its full capacity. Three-component beamforming extracts the polarizations, azimuths and phase velocities of coherent waves as a function of frequency, providing a detailed characterization of the seismic wavefield. In this study, 3C beamforming of ambient seismic noise is used to determine surface wave velocities as a function of depth and propagation direction. Anisotropic velocities are assumed to relate to the presence of faults giving an indication of the maximum depth of permeability, a vital parameter for fluid circulation and heat flow throughout a geothermal field. Three-component beamforming was used to determine if the complex surface fracture system permeates deeper than is currently known. Our results show that anisotropy of seismic velocities does not decline significantly with depth, suggesting that faults and fractures, and hence permeability, persist below 3 km. Moreover, estimates of fast and slow directions, with respect to surface wave velocities, are used to determine the orientation of faults with depth. The north-east (NE) and north–north-west (NNW) orientation of the fast direction corresponds to the orientation of the Arroyo Grande and Maxtaloya–Los Humeros Fault swarms, respectively. NE and NNW orientations of anisotropy align with other major faults within the LHGF at depths permeating to 6 km.

1 citations

Frequently Asked Questions (1)
Q1. What contributions have the authors mentioned in the paper "Local earthquake tomography at los humeros geothermal field (mexico)" ?

The authors improved the classical local earthquake tomography by using a postprocessing statistical approach. The authors interpret high Vp/Vs features as fluid bearing regions potentially favorable for further geothermal exploitation.