Maps of Dust IR Emission for Use in Estimation of Reddening and CMBR Foregrounds
TL;DR: In this paper, the authors presented a reprocessed composite of the COBE/DIRBE and IRAS/ISSA maps, with the zodiacal foreground and confirmed point sources removed.
Abstract: We present a full sky 100 micron map that is a reprocessed composite of the COBE/DIRBE and IRAS/ISSA maps, with the zodiacal foreground and confirmed point sources removed. Before using the ISSA maps, we remove the remaining artifacts from the IRAS scan pattern. Using the DIRBE 100 micron and 240 micron data, we have constructed a map of the dust temperature, so that the 100 micron map can be converted to a map proportional to dust column density. The result of these manipulations is a map with DIRBE-quality calibration and IRAS resolution.
To generate the full sky dust maps, we must first remove zodiacal light contamination as well as a possible cosmic infrared background (CIB). This is done via a regression analysis of the 100 micron DIRBE map against the Leiden- Dwingeloo map of H_I emission, with corrections for the zodiacal light via a suitable expansion of the DIRBE 25 micron flux. For the 100 micron map, no significant CIB is detected. In the 140 micron and 240 micron maps, where the zodiacal contamination is weaker, we detect the CIB at surprisingly high flux levels of 32 \pm 13 nW/m^2/sr at 140 micron, and 17 \pm 4 nW/m^2/sr at 240 micron (95% confidence). This integrated flux is ~2 times that extrapolated from optical galaxies in the Hubble Deep Field.
The primary use of these maps is likely to be as a new estimator of Galactic extinction. We demonstrate that the new maps are twice as accurate as the older Burstein-Heiles estimates in regions of low and moderate reddening. These dust maps will also be useful for estimating millimeter emission that contaminates CMBR experiments and for estimating soft X-ray absorption.
Figures (15)
![FIG. 1.ÈThe 100 kmÈH I correlation with (a) no correction, (b) linear correction, and (c) quadratic correction for zodiacal contamination. The Ðts in the range [0, 200] K km s~1 are shown as solid lines.](/figures/fig-1-ethe-100-kmeh-i-correlation-with-a-no-correction-b-j2j6qo00.png)
FIG. 1.ÈThe 100 kmÈH I correlation with (a) no correction, (b) linear correction, and (c) quadratic correction for zodiacal contamination. The Ðts in the range [0, 200] K km s~1 are shown as solid lines. 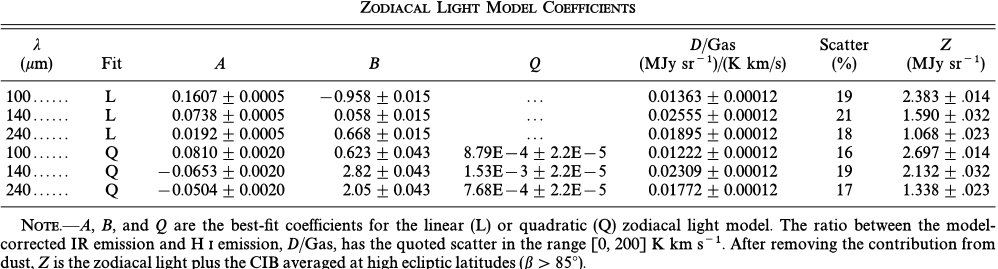
TABLE 2 
FIG. 13.ÈColor-color diagram for PSC sources. The diagonal line efficiently discriminates between galaxies (above the line) and stars (below the line). The square box is a strict color cut that retains 70% of stars. For clarity, only 1/10 of the stars are plotted. 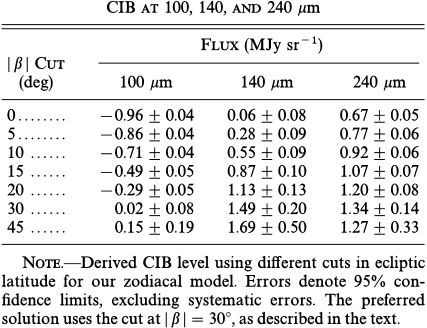
TABLE 3 ![FIG. 7.ÈSlice of sky from (a) the BH map, (b) the Leiden-Dwingeloo H I map, (c) our dust map with DIRBE resolution, and (d) our dust map with IRAS resolution. The slice measures approximately 90¡ ] 30¡, centered at l \ 100¡, b \ ]35¡.](/figures/fig-7-eslice-of-sky-from-a-the-bh-map-b-the-leiden-dwingeloo-1rzt4l41.png)
FIG. 7.ÈSlice of sky from (a) the BH map, (b) the Leiden-Dwingeloo H I map, (c) our dust map with DIRBE resolution, and (d) our dust map with IRAS resolution. The slice measures approximately 90¡ ] 30¡, centered at l \ 100¡, b \ ]35¡. 
FIG. 2.ÈRatio of recovered vs. true column density of dust using a single-temperature Ðt to two components. A fraction of dust at tem-f Bperature is added to 18 K dust. The recovered column density is alwaysT Blower than the true column density, with contours spaced in units of 0.1. 
FIG. 4.ÈFourier destriping of plate 379. (a) Raw ISSA HCON-0 image ; (b) FFT with wavenumber 0 in center ; (c) destriped image ; (d) FFT of destriped image. Note that one of the bins contains less power than the others. These are modes in which power from HCON-3 has replaced power in the otherkhHCONs; however HCON-3 covers only half the plate, resulting in less power. 
FIG. 14.ÈContamination at 100 km from faint stars. The solid histogram represents the derived contamination at 100 km from stars with Ñuxes below our Ñux cut. The dotted histogram shows the Ñux from stars explicitly removed from the maps. 
TABLE 4 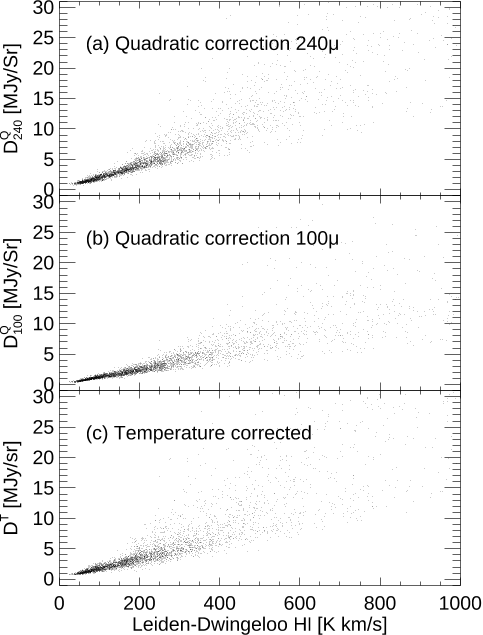
FIG. 10.ÈH I correlation with (a) DIRBE 240 km (corrected for zodiacal contamination), (b) DIRBE 100 km (also corrected), and (c) our derived dust column density. This plot demonstrates that the gas to dust relationship deteriorates at high Ñux levels. 
TABLE 5 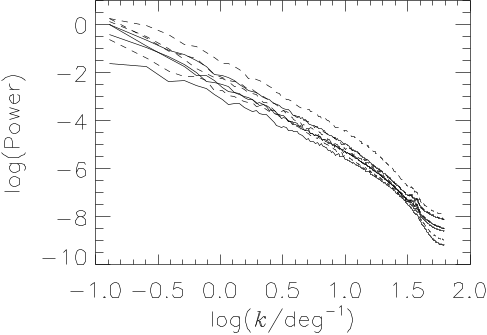
FIG. 9.ÈPower spectrum of dust. The four solid curves represent four quadrants in the north Galactic sky at b [ 45¡, while the four dashed curves represent four quadrants of the south Galactic sky. 
TABLE 1 
FIG. 6.ÈResiduals from the B[V vs. regression, plotted againstMg2foreground reddening, for (a) the BH maps and (b) the DIRBE/IRAS maps. Pluses represent galaxies at southern declinations where the BH maps lack dust-to-gas ratio information, and asterisks are those lacking any BH values. 
TABLE 6
![FIG. 1.ÈThe 100 kmÈH I correlation with (a) no correction, (b) linear correction, and (c) quadratic correction for zodiacal contamination. The Ðts in the range [0, 200] K km s~1 are shown as solid lines.](/figures/fig-1-ethe-100-kmeh-i-correlation-with-a-no-correction-b-j2j6qo00.webp)


![FIG. 7.ÈSlice of sky from (a) the BH map, (b) the Leiden-Dwingeloo H I map, (c) our dust map with DIRBE resolution, and (d) our dust map with IRAS resolution. The slice measures approximately 90¡ ] 30¡, centered at l \ 100¡, b \ ]35¡.](/figures/fig-7-eslice-of-sky-from-a-the-bh-map-b-the-leiden-dwingeloo-1rzt4l41.webp)


Citations
More filters
University of California, Berkeley1, Lawrence Berkeley National Laboratory2, Instituto Superior Técnico3, Pierre-and-Marie-Curie University4, Stockholm University5, European Southern Observatory6, Collège de France7, University of Cambridge8, University of Barcelona9, Yale University10, Space Telescope Science Institute11, European Space Agency12, University of New South Wales13
TL;DR: In this paper, the mass density, Omega_M, and cosmological-constant energy density of the universe were measured using the analysis of 42 Type Ia supernovae discovered by the Supernova Cosmology project.
Abstract: We report measurements of the mass density, Omega_M, and
cosmological-constant energy density, Omega_Lambda, of the universe based on
the analysis of 42 Type Ia supernovae discovered by the Supernova Cosmology
Project. The magnitude-redshift data for these SNe, at redshifts between 0.18
and 0.83, are fit jointly with a set of SNe from the Calan/Tololo Supernova
Survey, at redshifts below 0.1, to yield values for the cosmological
parameters. All SN peak magnitudes are standardized using a SN Ia lightcurve
width-luminosity relation. The measurement yields a joint probability
distribution of the cosmological parameters that is approximated by the
relation 0.8 Omega_M - 0.6 Omega_Lambda ~= -0.2 +/- 0.1 in the region of
interest (Omega_M <~ 1.5). For a flat (Omega_M + Omega_Lambda = 1) cosmology we
find Omega_M = 0.28{+0.09,-0.08} (1 sigma statistical) {+0.05,-0.04}
(identified systematics). The data are strongly inconsistent with a Lambda = 0
flat cosmology, the simplest inflationary universe model. An open, Lambda = 0
cosmology also does not fit the data well: the data indicate that the
cosmological constant is non-zero and positive, with a confidence of P(Lambda >
0) = 99%, including the identified systematic uncertainties. The best-fit age
of the universe relative to the Hubble time is t_0 = 14.9{+1.4,-1.1} (0.63/h)
Gyr for a flat cosmology. The size of our sample allows us to perform a variety
of statistical tests to check for possible systematic errors and biases. We
find no significant differences in either the host reddening distribution or
Malmquist bias between the low-redshift Calan/Tololo sample and our
high-redshift sample. The conclusions are robust whether or not a
width-luminosity relation is used to standardize the SN peak magnitudes.
16,838 citations
TL;DR: In this article, the spectral evolution of stellar populations at ages between 100,000 yr and 20 Gyr at a resolution of 3 A across the whole wavelength range from 3200 to 9500 A for a wide range of metallicities.
Abstract: We present a new model for computing the spectral evolution of stellar populations at ages between 100,000 yr and 20 Gyr at a resolution of 3 A across the whole wavelength range from 3200 to 9500 A for a wide range of metallicities. These predictions are based on a newly available library of observed stellar spectra. We also compute the spectral evolution across a larger wavelength range, from 91 A to 160 micron, at lower resolution. The model incorporates recent progress in stellar evolution theory and an observationally motivated prescription for thermally-pulsing stars on the asymptotic giant branch. The latter is supported by observations of surface brightness fluctuations in nearby stellar populations. We show that this model reproduces well the observed optical and near-infrared colour-magnitude diagrams of Galactic star clusters of various ages and metallicities. Stochastic fluctuations in the numbers of stars in different evolutionary phases can account for the full range of observed integrated colours of star clusters in the Magellanic Clouds. The model reproduces in detail typical galaxy spectra from the Early Data Release (EDR) of the Sloan Digital Sky Survey (SDSS). We exemplify how this type of spectral fit can constrain physical parameters such as the star formation history, metallicity and dust content of galaxies. Our model is the first to enable accurate studies of absorption-line strengths in galaxies containing stars over the full range of ages. Using the highest-quality spectra of the SDSS EDR, we show that this model can reproduce simultaneously the observed strengths of those Lick indices that do not depend strongly on element abundance ratios [abridged].
10,384 citations
Donald G. York1, Jennifer Adelman2, John E. Anderson2, Scott F. Anderson3 +148 more•Institutions (29)
TL;DR: The Sloan Digital Sky Survey (SDSS) as discussed by the authors provides the data to support detailed investigations of the distribution of luminous and non-luminous matter in the universe: a photometrically and astrometrically calibrated digital imaging survey of π sr above about Galactic latitude 30° in five broad optical bands to a depth of g' ~ 23 mag.
Abstract: The Sloan Digital Sky Survey (SDSS) will provide the data to support detailed investigations of the distribution of luminous and nonluminous matter in the universe: a photometrically and astrometrically calibrated digital imaging survey of π sr above about Galactic latitude 30° in five broad optical bands to a depth of g' ~ 23 mag, and a spectroscopic survey of the approximately 106 brightest galaxies and 105 brightest quasars found in the photometric object catalog produced by the imaging survey. This paper summarizes the observational parameters and data products of the SDSS and serves as an introduction to extensive technical on-line documentation.
9,835 citations
TL;DR: In this paper, the authors measured the difference between the measured and predicted colors of a star, as derived from stellar parameters from the Sloan Extension for Galactic Understanding and Exploration Stellar Parameter Pipeline, and achieved uncertainties of 56, 34, 25, and 29 mmag in the colors u − g, g − r, r − i, and i − z, per star.
Abstract: We present measurements of dust reddening using the colors of stars with spectra in the Sloan Digital Sky Survey. We measure reddening as the difference between the measured and predicted colors of a star, as derived from stellar parameters from the Sloan Extension for Galactic Understanding and Exploration Stellar Parameter Pipeline. We achieve uncertainties of 56, 34, 25, and 29 mmag in the colors u – g, g – r, r – i, and i – z, per star, though the uncertainty varies depending on the stellar type and the magnitude of the star. The spectrum-based reddening measurements confirm our earlier "blue tip" reddening measurements, finding reddening coefficients different by –3%, 1%, 1%, and 2% in u – g, g – r, r – i, and i – z from those found by the blue tip method, after removing a 4% normalization difference. These results prefer an RV = 3.1 Fitzpatrick reddening law to O'Donnell or Cardelli et al. reddening laws. We provide a table of conversion coefficients from the Schlegel et al. (SFD) maps of E(B – V) to extinction in 88 bandpasses for four values of RV , using this reddening law and the 14% recalibration of SFD first reported by Schlafly et al. and confirmed in this work.
6,643 citations
Kevork N. Abazajian1, Jennifer K. Adelman-McCarthy2, Marcel A. Agüeros3, S. Allam4 +220 more•Institutions (77)
TL;DR: A series of improvements to the spectroscopic reductions are described, including better flat fielding and improved wavelength calibration at the blue end, better processing of objects with extremely strong narrow emission lines, and an improved determination of stellar metallicities.
Abstract: This paper describes the Seventh Data Release of the Sloan Digital Sky Survey (SDSS), marking the completion of the original goals of the SDSS and the end of the phase known as SDSS-II. It includes 11,663 deg^2 of imaging data, with most of the ~2000 deg^2 increment over the previous data release lying in regions of low Galactic latitude. The catalog contains five-band photometry for 357 million distinct objects. The survey also includes repeat photometry on a 120° long, 2°.5 wide stripe along the celestial equator in the Southern Galactic Cap, with some regions covered by as many as 90 individual imaging runs. We include a co-addition of the best of these data, going roughly 2 mag fainter than the main survey over 250 deg^2. The survey has completed spectroscopy over 9380 deg^2; the spectroscopy is now complete over a large contiguous area of the Northern Galactic Cap, closing the gap that was present in previous data releases. There are over 1.6 million spectra in total, including 930,000 galaxies, 120,000 quasars, and 460,000 stars. The data release includes improved stellar photometry at low Galactic latitude. The astrometry has all been recalibrated with the second version of the USNO CCD Astrograph Catalog, reducing the rms statistical errors at the bright end to 45 milliarcseconds per coordinate. We further quantify a systematic error in bright galaxy photometry due to poor sky determination; this problem is less severe than previously reported for the majority of galaxies. Finally, we describe a series of improvements to the spectroscopic reductions, including better flat fielding and improved wavelength calibration at the blue end, better processing of objects with extremely strong narrow emission lines, and an improved determination of stellar metallicities.
5,665 citations