
All figures (15)
![FIG. 1.ÈThe 100 kmÈH I correlation with (a) no correction, (b) linear correction, and (c) quadratic correction for zodiacal contamination. The Ðts in the range [0, 200] K km s~1 are shown as solid lines.](/figures/fig-1-ethe-100-kmeh-i-correlation-with-a-no-correction-b-j2j6qo00.png) FIG. 1.ÈThe 100 kmÈH I correlation with (a) no correction, (b) linear correction, and (c) quadratic correction for zodiacal contamination. The Ðts in the range [0, 200] K km s~1 are shown as solid lines.
FIG. 1.ÈThe 100 kmÈH I correlation with (a) no correction, (b) linear correction, and (c) quadratic correction for zodiacal contamination. The Ðts in the range [0, 200] K km s~1 are shown as solid lines.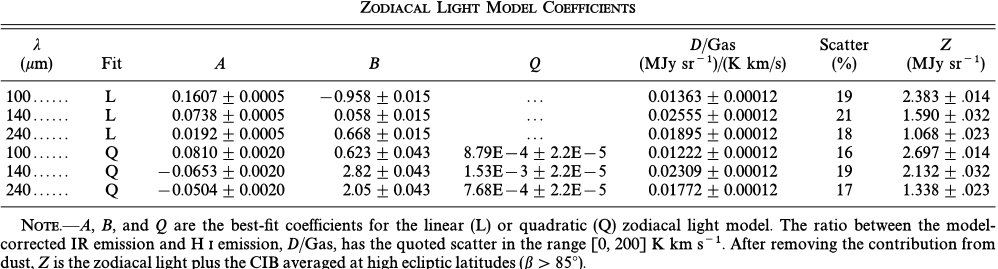 TABLE 2
 FIG. 13.ÈColor-color diagram for PSC sources. The diagonal line efficiently discriminates between galaxies (above the line) and stars (below the line). The square box is a strict color cut that retains 70% of stars. For clarity, only 1/10 of the stars are plotted.
 TABLE 3
![FIG. 7.ÈSlice of sky from (a) the BH map, (b) the Leiden-Dwingeloo H I map, (c) our dust map with DIRBE resolution, and (d) our dust map with IRAS resolution. The slice measures approximately 90¡ ] 30¡, centered at l \ 100¡, b \ ]35¡.](/figures/fig-7-eslice-of-sky-from-a-the-bh-map-b-the-leiden-dwingeloo-1rzt4l41.png) FIG. 7.ÈSlice of sky from (a) the BH map, (b) the Leiden-Dwingeloo H I map, (c) our dust map with DIRBE resolution, and (d) our dust map with IRAS resolution. The slice measures approximately 90¡ ] 30¡, centered at l \ 100¡, b \ ]35¡.
FIG. 7.ÈSlice of sky from (a) the BH map, (b) the Leiden-Dwingeloo H I map, (c) our dust map with DIRBE resolution, and (d) our dust map with IRAS resolution. The slice measures approximately 90¡ ] 30¡, centered at l \ 100¡, b \ ]35¡. FIG. 2.ÈRatio of recovered vs. true column density of dust using a single-temperature Ðt to two components. A fraction of dust at tem-f Bperature is added to 18 K dust. The recovered column density is alwaysT Blower than the true column density, with contours spaced in units of 0.1.
 FIG. 4.ÈFourier destriping of plate 379. (a) Raw ISSA HCON-0 image ; (b) FFT with wavenumber 0 in center ; (c) destriped image ; (d) FFT of destriped image. Note that one of the bins contains less power than the others. These are modes in which power from HCON-3 has replaced power in the otherkhHCONs; however HCON-3 covers only half the plate, resulting in less power.
 FIG. 14.ÈContamination at 100 km from faint stars. The solid histogram represents the derived contamination at 100 km from stars with Ñuxes below our Ñux cut. The dotted histogram shows the Ñux from stars explicitly removed from the maps.
 TABLE 4
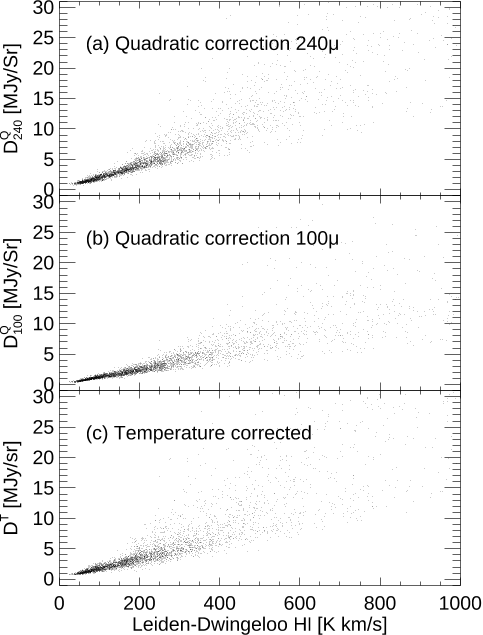 FIG. 10.ÈH I correlation with (a) DIRBE 240 km (corrected for zodiacal contamination), (b) DIRBE 100 km (also corrected), and (c) our derived dust column density. This plot demonstrates that the gas to dust relationship deteriorates at high Ñux levels.
 TABLE 5
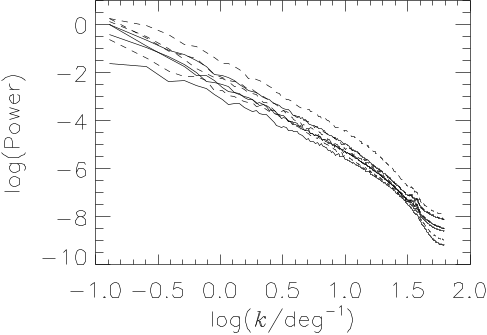 FIG. 9.ÈPower spectrum of dust. The four solid curves represent four quadrants in the north Galactic sky at b [ 45¡, while the four dashed curves represent four quadrants of the south Galactic sky.
 TABLE 1
 FIG. 6.ÈResiduals from the B[V vs. regression, plotted againstMg2foreground reddening, for (a) the BH maps and (b) the DIRBE/IRAS maps. Pluses represent galaxies at southern declinations where the BH maps lack dust-to-gas ratio information, and asterisks are those lacking any BH values.
 TABLE 6
![FIG. 1.ÈThe 100 kmÈH I correlation with (a) no correction, (b) linear correction, and (c) quadratic correction for zodiacal contamination. The Ðts in the range [0, 200] K km s~1 are shown as solid lines.](/figures/fig-1-ethe-100-kmeh-i-correlation-with-a-no-correction-b-j2j6qo00.webp)


![FIG. 7.ÈSlice of sky from (a) the BH map, (b) the Leiden-Dwingeloo H I map, (c) our dust map with DIRBE resolution, and (d) our dust map with IRAS resolution. The slice measures approximately 90¡ ] 30¡, centered at l \ 100¡, b \ ]35¡.](/figures/fig-7-eslice-of-sky-from-a-the-bh-map-b-the-leiden-dwingeloo-1rzt4l41.webp)


