scispace - formally typeset
Search or ask a question
Journal ArticleDOI

Measurements of Heat Capacity and Enthalpy of Phase Change Materials by Adiabatic Scanning Calorimetry

TL;DR: In this paper, the authors present an alternative approach to arrive simultaneously at the equilibrium enthalpy curve and at the heat capacity of phase change materials (PCMs) by using adiabatic scanning calorimetry (ASC).
Abstract: Phase change materials (PCMs) are substances exhibiting phase transitions with large latent heats that can be used as thermal storage materials with a large energy storage capacity in a relatively narrow temperature range. In many practical applications the solid–liquid phase change is used. For applications accurate knowledge of different thermal parameters has to be available. In particular, the temperature dependence of the enthalpy around the phase transition has to be known with good accuracy. Usually, the phase transitions of PCMs are investigated with differential scanning calorimetry (DSC) at fast dynamic scanning rates resulting in the effective heat capacity from which the (total) heat of transition can be determined. Here we present adiabatic scanning calorimetry (ASC) as an alternative approach to arrive simultaneously at the equilibrium enthalpy curve and at the heat capacity. The applicability of ASC is illustrated with measurements on paraffin-based PCMs and on a salt hydrate PCM.

Summary (3 min read)

1 Introduction

  • Phase change materials (PCMs) are substances exhibiting phase transitions with large latent heats and can be used as thermal storage materials with a large energy storage capacity in a relatively narrow temperature range [1] [2] [3] .
  • In nowadays applications mainly two types of PCMs are in use.
  • A first category includes organic materials, mainly paraffins and to some extent fatty acids.
  • In particular, the temperature dependence of the enthalpy around the phase transition has to be known with good accuracy.
  • Usually, the phase transitions of PCMs are investigated with differential scanning calorimetry (DSC).

2 Experimental Method

  • The so-called ASC technique was introduced around 1980 [5] and extensively used for the study of many different types of phase transitions, in particular in liquid mixtures and liquid crystals.
  • Here the authors will only give a description of the two principal modes of operation of an ASC and some key features of the data analysis.

2.1 Principal Modes of Operation of an ASC

  • Since the beginning of the twentieth century, several different calorimetric techniques with varying degrees of accuracy and precision have been developed.
  • Traditionally, heat-capacity measurements are carried out by means of the adiabatic heat pulse method, where a known amount of heat, Q, is (usually electrically) applied to the sample and the corresponding temperature rise, T , is measured.
  • Rewriting Eq. 1 in the following way: EQUATION (with t time and P power), shows the possibility of operating in dynamic modes.
  • These modes require different settings for the thermal environment (thermal shields) of the sample.
  • Implementing a cooling run with constant power is less obvious and has to be realized by imposing a constant leaking power between the sample (cell) and its isothermal environment.

2.2 Implementation of the ASC Concept

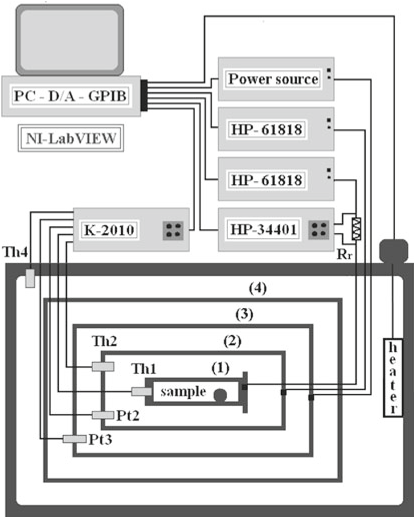
  • Figure 1 gives a schematic diagram of a four-stage ASC that can operate between room temperature and about 470 K.
  • Each of the stages (1 to 4) has its own thermometer (Th i ) and its own electrical (e.g., constantan) heating wires.
  • To minimize further thermal transfer between stages, all electric connecting wires are, on passing from one stage to another, several thermal diffusion lengths long (for temperature variations at relevant time scales), and neatly coiled not to touch the wall of either stage.
  • Different sizes of sample cells can be suspended in the calorimeter.
  • For liquid samples it is also possible to stir the samples inside the cell.

2.3 Analysis of the Direct Experimental Data

  • These results are graphically displayed in the two central boxes of Fig. 2 for a weakly first-order transition.
  • Depending on the temperature range to be covered, a typical run can take several days or weeks (for very slow scans).
  • Proper calibration of the (only weakly T dependent) heat capacity of the empty cell and knowing the total amount of sample allows one to calculate the specific heat capacity of the sample.
  • This is, however, an idealized situation for a perfectly pure one-component sample.
  • For single components as well as for eutectic mixtures, the two-phase region can be very small depending on the unknown (and unavoidable) small amounts of impurities.

3 Materials

  • Adiabatic scanning calorimetry (ASC) measurements were carried out for three n-paraffinand waxes-based PCM materials.
  • These materials were purchased from Rubitherm GmbH, Germany.
  • The first material has a quoted melting range of 25 C).
  • On the outside of both cells, an electric heating wire was distributed and glued over the entire length.
  • Adiabatic scanning calorimetry (ASC) measurements results are also reported for the pure salt hydrate calcium chloride hexahydrate (CaCl 2 6H 2 O).

4 Results and Discussion

  • The characteristics of the ASC runs as well as relevant results for the different materials are included in Table 1 .
  • For heating runs this is the temperature at which the whole sample has melted, and for cooling runs, the temperature where the sample starts to solidify.
  • In the lower part of that figure the temperature dependence of the enthalpy for a heating run is given by the thick curve and by the thin one for a cooling run.
  • It should be noted that in this these curves are not fit curves through the data points but collections of very large numbers of closely spaced direct data points.
  • These effects are ascribed to premelting of hydrocarbon tails in the crystalline phase with increasing temperature, and gradual loss of the orientational order around the chain axes [11] .

4.2 Results for Calcium Chloride Hexahydrate

  • The unusual shape of the curve for the cooling run at the hightemperature side is the result of substantial supercooling and then a sudden release of solidification heat in the thermally well insulated cell, resulting in an abrupt increase of the temperature to the real melting temperature of the substance.
  • At that temperature the sample suddenly solidified and the temperature raised to near the melting temperature.
  • Further enthalpy release (to the controlled thermal environment of the cell) occurred in the continuation of the cooling run.
  • In the heating run and also in the cooling run, pretransitional enthalpy changes are clearly present, similar to what is observed for the paraffin-based PCMs.
  • The argument of increased chain mobility does not apply here.

5 Summary and Conclusions

  • ASC is introduced as a suitable tool for simultaneous measurements of the temperature dependence of the enthalpy and of the heat capacity of PCMs near their solid-liquid phase transition.
  • Moreover, because of the very slow rates in heating the samples, the ASC measurements result in the equilibrium temperature dependence of the enthalpy.
  • Results are reported for three paraffin-and wax-based PCMs obtained from an industrial supplier (Rubitherm GmbH, Germany).
  • Results are also represented in several figures.
  • For the heating run in the salt hydrate the shape of the enthalpy curve is analogous to that of the paraffin-based materials.

Did you find this useful? Give us your feedback

Figures (8)

Content maybe subject to copyright    Report

Int J Thermophys (2011) 32:913–924
DOI 10.1007/s10765-011-0984-0
Measurements of Heat Capacity and Enthalpy of Phase
Change Materials by Adiabatic Scanning Calorimetry
Patricia Losada-Pérez · Chandra Shekhar Pati Tripathi ·
Jan Leys · George Cordoyiannis · Christ Glorieux ·
Jan Thoen
Received: 26 August 2010 / Accepted: 23 March 2011 / Published online: 20 April 2011
© Springer Science+Business Media, LLC 2011
Abstract Phase change materials (PCMs) are substances exhibiting phase transi-
tions with large latent heats that can be used as thermal storage materials with a large
energy storage capacity in a relatively narrow temperature range. In many practical
applications the solid–liquid phase change is used. For applications accurate knowl-
edge of different thermal parameters has to be available. In particular, the temperature
dependence of the enthalpy around the phase transition has to be known with good
accuracy. Usually, the phase transitions of PCMs are investigated with differential
scanning calorimetry (DSC) at fast dynamic scanning rates resulting in the effective
heat capacity from which the (total) heat of transition can be determined. Here we
present adiabatic scanning calorimetry (ASC) as an alternative approach to arrive
simultaneously at the equilibrium enthalpy curve and at the heat capacity. The appli-
cability of ASC is illustrated with measurements on paraffin-based PCMs and on a
salt hydrate PCM.
Keywords Adiabatic scanning calorimetry · Enthalpy · Heat capacity ·
Latent heat · Phase change materials
P. Losada-Pérez · C. S. P. Tripathi · J. Leys (
B
) · G. Cordoyiannis · C. Glorieux · J. Thoen
Laboratorium voor Akoestiek en Thermische Fysica, Departement Natuurkunde en Sterrenkunde,
Katholieke Universiteit Leuven, Celestijnenlaan 200D, 3001 Leuven, Belgium
e-mail: jan.leys@fys.kuleuven.be
J. Thoen
e-mail: jan.thoen@fys.kuleuven.be
Present Address:
G. Cordoyiannis
Condensed Matter Physics Departement, Jožef Stefan Institute, Jamova 39, 1000 Ljubljana, Slovenia
123

914 Int J Thermophys (2011) 32:913–924
1 Introduction
Phase change materials (PCMs) are substances exhibiting phase transitions with large
latent heats and can be used as thermal storage materials with a large energy stor-
age capacity in a relatively narrow temperature range [13]. In principle latent heat
storage can be achieved through a solid–solid, solid–liquid, solid–gas, or liquid–gas
phase change. In practical applications where temperature control is important, the
solid–liquid phase change is mostly used. In nowadays applications mainly two types
of PCMs are in use. A first category includes organic materials, mainly paraffins and to
some extent fatty acids. The second large category includes the inorganic salt hydrates.
Recently, also eutectic mixture combinations of organic and non-organic compounds
are being considered. The choice of material depends not only on the intrinsic prop-
erties of the PCM but also on the practical application envisioned. A large number of
PCMs are available in the temperature range from well below 0
C to 200
C.
For proper design of application devices an accurate knowledge of different ther-
mal parameters has to be available. In particular, the temperature dependence of the
enthalpy around the phase transition has to be known with good accuracy. Usually,
the phase transitions of PCMs are investigated with differential scanning calorimetry
(DSC). In DSC a reference sample is made to increase (or decrease) its temperature at
a constant rate and the PCM sample is forced to follow this rate by changing the power
delivered to it. This allows one to extract the (effective) heat capacity as a function of
temperature. The transition heat is then determined by integrating the heat capacity
curve. Moreover, DSC uses (for sufficient resolution) fast scanning rates (1 K · min
1
to 10 K · min
1
), quite often resulting in (apparent) overheating and undercooling
effects. Efforts to (partly) overcome these problems for latent heat measurements of
PCMs have resulted in running a DSC in an isothermal step mode and/or by applying
a T -history method [4].
In this paper we present adiabatic scanning calorimetry (ASC) as an interesting
complementary tool to measure simultaneously the temperature dependence of the
enthalpy as well as of the heat capacity near the phase transitions in PCMs. ASC has
been extensively used to discriminate between first-order (exhibiting a discontinuous
step in the enthalpy) and second-order (with a continuous temperature dependence
of the enthalpy) phase transitions and to detect heat-capacity anomalies near critical
points in several types of soft matter systems, such as, e.g., liquid crystals and critical
mixtures [58]. With ASC the problems with superheating or supercooling can in
many cases be avoided and true equilibrium data can be obtained by using very slow
rates as slow as 2 to 3 orders of magnitude slower than in DSC. After a description of
the ASC technique, we present results for the temperature dependence of the enthalpy
and of the (effective) heat capacity of two paraffin-based PCMs and of one pure salt
hydrate. In addition, also results for a paraffin-based powder PCM are given.
2 Experimental Method
The so-called ASC technique was introduced around 1980 [5] and extensively used
for the study of many different types of phase transitions, in particular in liquid
123

Int J Thermophys (2011) 32:913–924 915
mixtures and liquid crystals. An extensive description of the technique and major
results can be found in recent overviews [7,8]. Here we will only give a description
of the two principal modes of operation of an ASC and some key features of the data
analysis.
2.1 Principal Modes of Operation of an ASC
Since the beginning of the twentieth century, several different calorimetric techniques
with varying degrees of accuracy and precision have been developed. Traditionally,
heat-capacity measurements are carried out by means of the adiabatic heat pulse
method, where a known amount of heat, Q, is (usually electrically) applied to the
sample and the corresponding temperature rise, T , is measured. The heat capacity
(at constant pressure) of a sample at a given temperature is then obtained from
C
p
=
Q
T
(1)
In this way one looks at the derivative of the enthalpy H(T ) curve and no information
can be obtained on enthalpy discontinuities or latent heats (and thus on the order of a
given phase transition). Rewriting Eq. 1 in the following way:
C
p
=
dQ
dT
=
dQ/dt
dT/dt
=
P
˙
T
(2)
(with t time and P power), shows the possibility of operating in dynamic modes.
By keeping P or
˙
T constant, while increasing or decreasing the temperature of the
sample (P and
˙
T positive or negative), four practical modes of operation are obtained.
These modes require different settings for the (adiabatic) thermal environment (thermal
shields) of the sample. The most interesting modes (and for enthalpy measurements
where latent heats are present, the only feasable ones) are the ones with constant heat-
ing or cooling power P. Since in the PCM phase transitions substantial latent heats are
present, we will only give a general description of the constant power modes. Detailed
information on all modes can be found elsewhere [8].
In the heating mode with constant (electrically applied) power P
e
to the sample
(cell), in order to maintain the adiabatic conditions, one has to arrange for negligibly
small leaking power P
l
to the environment, measure P
e
and carefully follow the evo-
lution of the sample temperature T(t) with time t. Because the heating rate is inversely
proportional to C
p
, the increase of C
p
at a second-order phase transition will result
in a decrease of the rate and facilitate thermodynamic equilibrium and servo-control
of adiabatic conditions. At first-order transitions, in principle, the rate is zero at the
transition for a time interval given by
t = t
f
t
i
=
L
P
e
(3)
123

916 Int J Thermophys (2011) 32:913–924
where L is the latent heat of the transition, and t
i
and t
f
are the times during the scan
at which the transition is reached and left. The direct experimental result T (t) gives
the enthalpy as a function of temperature by
H = H(T
0
) + P
e
(t t
0
) (4)
with T
0
the starting temperature of the scanning run at the time t
0
. Implementing a
cooling run with constant (negative) power is less obvious and has to be realized by
imposing a constant leaking power between the sample (cell) and its isothermal envi-
ronment. This can be done by imposing a constant temperature difference between
the cell and the isothermal environment. These conditions have to be verified and usu-
ally involve calibration (certainly for scans over large temperature ranges) to arrive
at absolute values for the heat capacity or enthalpy. This type of cooling run (with
negative power and negative rate) is very similar to the constant power heating mode
and also easily allows one to deal with first-order transitions. Although an ASC is
normally optimized for scanning, it can easily be operated as a normal heat pulse step
calorimeter as well. This can be very practical for calibration purposes and verification
of absolute heat-capacity values.
2.2 Implementation of the ASC Concept
Figure 1 gives a schematic diagram of a four-stage ASC that can operate between room
temperature and about 470 K. The centrally located cylindrical sample cell for liquids
is surrounded by three concentric (copper) thermal shields. Each of the stages (1 to 4)
has its own thermometer (Th
i
) and its own electrical (e.g., constantan) heating wires.
On stages 1 to 3 the heating wires are evenly distributed and wound in grooves and
thermally anchored with a good thermal conductive and electrically insulating epoxy.
Stage 4 of this calorimeter is composed of a hot air oven and the outer thermal and
vacuum shield of the actual calorimeter with three internal stages. The temperature
of the oven is measured and controlled by means of the thermistor Th
4
and computer
regulated power delivery to the heater of the oven. The stages are in very poor thermal
contact, and the space between them is vacuum pumped. The sample cell is suspended
by thin nylon threads inside stage 2. To minimize further thermal transfer between
stages, all electric connecting wires are, on passing from one stage to another, several
thermal diffusion lengths long (for temperature variations at relevant time scales),
and neatly coiled not to touch the wall of either stage. These wires are also thermally
anchored at each stage. Different sizes of sample cells can be suspended in the calo-
rimeter. For the PCM measurements we used cells with a volume of 5 cm
3
to 11 cm
3
.
For liquid samples it is also possible to stir the samples inside the cell. Stirring in the
horizontally mounted cylindrical cells is achieved by means of a metal ball that can
roll back and forth inside the cell by changing periodically the inclination of the plate
supporting the calorimeter.
123

Int J Thermophys (2011) 32:913–924 917
Fig. 1 Schematic diagram of a
four-stage ASC with typical
modern measurement and PC
controlled instrumentation. (1)
sample in sample holder with
stirring ball, thermistor Th
1
,and
heater (not shown); (2) shield
with thermistor Th
2
, platinum
reference thermometer Pt
2
,and
heater (not shown); (3) shield
with platinum thermometer Pt
3
and heater (not shown); and (4)
external vacuum tight shield in
hot air oven with thermistor Th
4
and heater. K-2010 (7.5 digit
multiplexer) and HP-34401 (6.5
digits) are multimeters. There
are two HP-6181B power
sources and one self-made one
2.3 Analysis of the Direct Experimental Data
The basic data measured very frequently as a function of time (typically every 3 s to
5 s) during a heating run in an ASC are the temperature of the sample and the holder
as well as the (constant) power. These results are graphically displayed in the two
central boxes of Fig. 2 for a weakly first-order transition. After a long temperature
stabilization time of stage 2 (shield around the sample cell) with zero power to the cell
(stage 1), the cell attains the same temperature (within a few tenths of a mK). Then
the power to the sample cell is switched on, at t
0
, to a chosen value depending on the
desired overall scanning rate. Depending on the temperature range to be covered, a
typical run can take several days or weeks (for very slow scans). The temperature is
measured with µK resolution, and the extremely large number of T (t) data allows
averaging (if desired) and determination of local derivatives resulting in nearly as
many
˙
T values as T (t) data points by using several (consecutive) data points in a
moving time derivative (adding one data point at one end and leaving out one at the
other end). A simple division of P by
˙
T at a given T (t) results immediately in a C
p
(T )
value at that temperature. These C
p
(T ) values are total heat capacities for the sample
and the sample holder together. Proper calibration of the (only weakly T dependent)
heat capacity of the empty cell and knowing the total amount of sample allows one to
calculate the specific heat capacity of the sample. In the case of a first-order transition,
the transition is reached at time t
i
. From that moment until its end at t
f
the temperature
remains constant over the time interval given by Eq. 3. According to Eq. 4, the direct
combination of t(T ) and P(t) data immediately results in the enthalpy as a function
123

Citations
More filters
Journal ArticleDOI
TL;DR: In this article, a heat storage unit containing 100 aluminium panels filled with a paraffin-based phase change materials (PCM) was investigated using laboratory experiments and numerical simulations.

114 citations

Journal ArticleDOI
TL;DR: In this paper, an experimental method was used for validating the heat transfer within phase change materials (PCMs) and two models, enthalpy and effective heat capacity models, were implemented and three impact factors were analyzed.
Abstract: An experimental method was used for validating the heat transfer within phase change materials (PCMs). The two models, enthalpy and effective heat capacity models, were implemented and three impact factors were analyzed. The results showed that it should not calculate using the same temperature range for the PCMs with different melting and freezing ranges. Narrower temperature range can make the enthalpy method more accurate. Also, the liquid fraction should be taken into account if the phase change had not completed. In addition, the proper treatment of latent heat made the effective heat capacity method more accurate than the enthalpy method.

39 citations

Journal ArticleDOI
29 Sep 2016-PLOS ONE
TL;DR: Results indicate that interactions are mainly driven by the hydrophobic components of the IL, which significantly distort the layer and promote vesicle rupture, and evidence the gradual decrease of the main phase transition temperature upon increasing IL concentration, reflecting increased disorder by weakening of lipid chain interactions.
Abstract: Despite the environmentally friendly reputation of ionic liquids (ILs), their safety has been recently questioned given their potential as cytotoxic agents. The fundamental mechanisms underlying the interactions between ILs and cells are less studied and by far not completely understood. Biomimetic films are here important biophysical model systems to elucidate fundamental aspects and mechanisms relevant for a large range of biological interaction ranging from signaling to drug reception or toxicity. Here we use dissipative quartz crystal microbalance QCM-D to examine the effect of aqueous imidazolium-based ionic liquid mixtures on solid-supported biomimetic membranes. Specifically, we assess in real time the effect of the cation chain length and the anion nature on a supported vesicle layer of the model phospholipid DMPC. Results indicate that interactions are mainly driven by the hydrophobic components of the IL, which significantly distort the layer and promote vesicle rupture. Our analyses evidence the gradual decrease of the main phase transition temperature upon increasing IL concentration, reflecting increased disorder by weakening of lipid chain interactions. The degree of rupture is significant for ILs with long hydrophobic cation chains and large hydrophobic anions whose behavior is reminiscent of that of antimicrobial peptides.

33 citations

Journal ArticleDOI
TL;DR: In this article, the authors used a differential scanning calorimetry (DSC) technique to measure heat capacities of diphenyl ether and biphenyl binary mixtures in the liquid phase up to T = 373.15 K. The well-known equations for Wilson and NRTL were used to correlate experimental solid liquid phase equilibrium data.

33 citations

Journal ArticleDOI
TL;DR: In this article, three phase-change materials (PCMs) in which a change between two phases may be used to store/release thermal energy were measured in a quasistatic regime by adiabatic scanning calorimetry and showed, within a certain temperature range, a single distinct jump and peak.

32 citations

References
More filters
Journal ArticleDOI
TL;DR: No correlation between the strength of the NI transition of a given compound and the pretransitional effects observed is found, neither dielectrically, nor thermally.
Abstract: The classification of phase transitions in first-order and second-order (or continuous) ones is widely used. The nematic-to-isotropic (NI) transition in liquid crystals is a weakly first-order transition, with only small discontinuities in enthalpy and specific volume at the transition which are not always easy to measure. On the other hand, fluctuation effects near the transition, typical for a continuous transition, are present because of the only weakly first-order character. In a recent paper [Phys. Rev. E 69, 022701 (2004)], it was concluded from the static dielectric permittivity in the isotropic phase near the NI transition that less polar mesogens (with little or no pretransitional effects) are characteristic for a first-order NI phase transition, whereas in the case of strongly polar ones (with large pretransitional effects) the NI transition is close to second order. In this paper, we address the question whether it is, indeed, possible to use these fluctuation effects in the isotropic phase to quantify the "strength" of a weakly first-order transition, i.e., how far it is from second order. Therefore, we measured the temperature dependence of the enthalpy near the NI transition of seven liquid crystals with adiabatic scanning calorimetry and compared the measured values of the latent heat with pretransitional effects in the dielectric constant and the specific heat capacity. The compounds used in the comparison are MBBA, 5CB, 8CB, 5NCS, 5CN, 8CHBT, and D7AB. From our analysis we find, contrary to the assertion in the above reference, no correlation between the strength of the NI transition of a given compound and the pretransitional effects observed, neither dielectrically, nor thermally.

68 citations

Journal ArticleDOI
TL;DR: In this paper, a high-resolution adiabatic scanning calorimetric technique has been proposed to distinguish between first-order and second-order phase transitions in addition to rendering highresolution information on fluctuations-induced pretransitional specific heat capacity behaviour.
Abstract: High-resolution calorimetric techniques have substantially contributed in characterising and understanding the delicate thermal behaviour near many phase transitions in liquid crystals. In this paper we describe a high-resolution adiabatic scanning calorimetric technique that has proven to be an important tool in discriminating between first-order and second-order phase transitions in addition to rendering high-resolution information on fluctuations-induced pretransitional specific heat capacity behaviour. The capabilities of adiabatic scanning calorimetry are illustrated with experimental results for the isotropic to nematic and the isotropic to smectic A transitions for a series of alkylcyanobiphenyl compounds. For the nematic to smectic A transition results are presented for pure compounds and mixtures of liquid crystals as well as on the effects of added non-mesogenic solutes and nanoparticles. For chiral molecules results for phase transitions involving blue phases and twist grain boundary phases are...

52 citations

Journal ArticleDOI
TL;DR: In this paper, the heat capacity of butyloxybenzylidene octylaniline has been measured from 0° to 95 °C and significant pretransitional effects are observed near both the first-order transition from the normal rigid crystal to the B phase plastic crystal and the firstorder melting transition from B phase to the smectic-A liquid crystal phase.
Abstract: The heat capacity of butyloxybenzylidene octylaniline has been measured from 0° to 95 °C. Significant pretransitional effects are observed near both the first-order transition from the normal rigid crystal to the B phase plastic crystal and the first-order melting transition from the B phase to the smectic-A liquid crystal phase. Data near the second-order smectic-A to nematic transition require a critical exponent α considerably greater than zero, in agreement with recent results on other materials.

31 citations

Journal ArticleDOI
TL;DR: In this article, a thermal study of the liquid crystals tridecylcyanobiphenyl and tetradecyanobipenyl has been performed by means of adiabatic scanning calorimetry.
Abstract: A thermal study of the liquid crystals tridecylcyanobiphenyl and tetradecylcyanobiphenyl has been performed by means of adiabatic scanning calorimetry. Both compounds exhibit only the smectic-A mesophase between the normal liquid and the crystalline phase and their phase transitions are strongly first order. A summary of the enthalpies and transition temperatures for all the smectic homologues of the cyanobiphenyl family is given, based on high-resolution measurements of the present work and previous studies.

22 citations

Journal ArticleDOI
TL;DR: In this article, the authors measured the temperature dependence of the enthalphy and specific heat capacity near 260 K orientational order-disorder transition of three different samples, using high-resolution adiabatic scanning calorimetry.
Abstract: We have measured the temperature dependence of the enthalphy and the specific heat capacity near 260 K orientational order-disorder transition of three different ${\mathrm{C}}_{60}$ samples, using high-resolution adiabatic scanning calorimetry. Extremely slow heating and cooling runs (at rates of the order of 100 mK/h) show that even at these low scanning rates the results are rate dependent. This indicates that even at such low rates the material is not in a thermodynamic equilibrium state and behaves as a system with a very long internal relaxation time (order of 10 h) in completing the first-order transition, as found in some binary systems.

20 citations

Frequently Asked Questions (10)
Q1. What are the contributions mentioned in the paper "Measurements of heat capacity and enthalpy of phase change materials by adiabatic scanning calorimetry" ?

Here the authors present adiabatic scanning calorimetry ( ASC ) as an alternative approach to arrive simultaneously at the equilibrium enthalpy curve and at the heat capacity. 

because of the very slow rates in heating the samples, the ASC measurements result in the equilibrium temperature dependence of the enthalpy. 

By keeping P or Ṫ constant, while increasing or decreasing the temperature of the sample (P and Ṫ positive or negative), four practical modes of operation are obtained. 

Measurements have been performed at very slow heating and cooling rates, typically three orders of magnitude slower than the ones usually applied in differential scanning calorimetry (DSC). 

In this paper the authors present adiabatic scanning calorimetry (ASC) as an interesting complementary tool to measure simultaneously the temperature dependence of the enthalpy as well as of the heat capacity near the phase transitions in PCMs. 

With ASC the problems with superheating or supercooling can in many cases be avoided and true equilibrium data can be obtained by using very slow rates as slow as 2 to 3 orders of magnitude slower than in DSC. 

After a long temperature stabilization time of stage 2 (shield around the sample cell) with zero power to the cell (stage 1), the cell attains the same temperature (within a few tenths of a mK). 

For PX 42 their transition temperatures (44.5 ◦C for heating and 43.7 ◦C for cooling) are at the upper edge of the 38 ◦C to 43 ◦C range of the manufacturer. 

In this paper, ASC is introduced as a suitable tool for simultaneous measurements of the temperature dependence of the enthalpy and of the (effective) heat capacity of PCMs near their solid–liquid phase transition. 

Efforts to (partly) overcome these problems for latent heat measurements of PCMs have resulted in running a DSC in an isothermal step mode and/or by applying a T -history method [4].