scispace - formally typeset
Search or ask a question
BookDOI

Measuring labour earnings inequality in post-apartheid South Africa

01 Jan 2020-Research Papers in Economics (Helsinki: The United Nations University World Institute for Development Economics Research (UNU-WIDER))-
TL;DR: In this paper, the validity of household survey data published by Statistics South Africa since 1993 and later integrated into the Post-Apartheid Labour Market Series (PALMS) was investigated.
Abstract: This paper investigates the validity of household survey data published by Statistics South Africa since 1993 and later integrated into the Post-Apartheid Labour Market Series (PALMS). A series of statistical adjustments are proposed, compared, and applied to primary data with the purpose of generating time-comparable, unbiased estimates, and accurate standard errors of labour earnings inequality coefficients.

Summary (6 min read)

1 The Post-Apartheid Labour Market Series

  • No consensus has been reached on the quality of long-run time series.
  • This project produced the so-called Post-Apartheid Labour Market Series : a stacked cross-section consisting of a harmonized compilation of four household surveys2 conducted after 1993 and focused on socioeconomic topics (Kerr et al. 2013).
  • The full description given in Kerr and Wittenberg (2019b: 16) is as follows: Monthly REAL earnings variable generated from the earnings amount data (not bracket information) across all waves where earnings amounts were asked and data have been released (all waves except OHS 1996 and QFLS waves 2008, 2009 and 2012).
  • For this reason, PALMS has generated a new strand of academic literature that explores the shortand long-term dynamics of wage inequality in post-transition South Africa, as well as a vibrant discussion on the need for higher-quality time-consistent and more frequent microeconomic data.
  • While it is not feasible to fully address all problems pertaining to primary data collection, the final remarks discuss what assumptions are needed in order to make defensible comparisons over time.

2 Labour income in post-apartheid South Africa: a literature review

  • A number of attempts to quantify inequality dynamics since the advent of democracy in South Africa explore the quality of surveys and censuses available in the country and eventually comment on the comparability of relevant variables over time.
  • Cichello et al. (2005) compare 1993 and 1998 earnings in the KwaZulu Natal Income Dynamics Study and reach different results when using the data as a panel and as a cross-section.
  • By contrast, the panel data indicate that workers who were already employed in the formal sector in 1993 experienced a fall in earnings, while informal workers started at a much lower average earnings point but experienced a rise due to mobility towards formal employment.
  • Wittenberg (2017c) effects further adjustments to yield PALMSv2.1 and calculates wage inequality through the Gini coefficient.
  • He argues that despite some noise in the estimates, the measurements made after the LFS 2007:1 are noticeably higher than those made from 2000 to 2006.

3 Working with PALMS

  • In PALMS, the variable reporting real earnings with no adjustment returns a mean of ZAR8,784 per month and a median of ZAR3,225.
  • The number of observations, 𝑁𝑁𝑜𝑜𝑜𝑜𝑜𝑜𝑜𝑜𝑜𝑜𝑜𝑜𝑜𝑜𝑜𝑜, in the original file is 963,492; this is higher than in any of the other approaches because every possible earner is included.
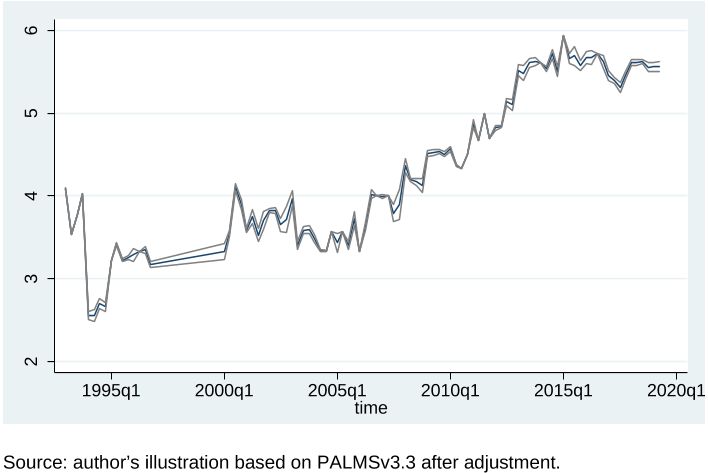
  • Plotting raw data against time also evidences the presence of issues.
  • Figure 1 displays a clear trend of average real earnings and a puzzling volatility, with suspicious falls in 1994 and after 2000 and rises in 2012, among other things.

3.1 The benchmark data set

  • The first issue encountered in exploring the statistical properties of PALMSv3.3 is that unrealistic values are found with respect to the age category, with 708 respondents supposedly reporting as more than 100 years old (one individual is recorded as being 142 years old).
  • For this reason, the sample is restricted to those typically assumed to be in the labour force—that is, to respondents in the age group 18–65 (see also Finn and Leibbrandt 2018).
  • Secondly, given that analysis is restricted to labour income, the unemployed, who can be assumed to receive zero earnings, are also excluded.
  • In the LFS, Wittenberg and Pirouz (2013: 6) note the impossibility of identifying ‘those working for themselves (employers/self-employed) and those working for others’.
  • Because of the shift in recorded self-employment, Wittenberg (2017c) accounts for inequality across wage-earners only.

3.2 Outliers

  • In the latter case, real earnings in logs are linearly regressed over gender, race, a quadratic in age, education, and occupation levels.
  • After removal of outliers, the scatterplot of studentized residuals shows no presence of extreme values; mean earnings are now ZAR7,035 and the median is ZAR3,293, and the final number of millionaires is two out of a total 435,048 observations.

3.3 Zero-earners

  • Zero-earners are workers who report null labour income, for various possible reasons: (i) the respondent earns a positive income but is lying; (ii) zero surplus at the end of the period is equated with zero income; (iii) the individual is receiving not monetary pay but experience, income in kind.
  • 8 6 Kerr and Wittenberg (2019a) report 476 flagged outliers, but using an old version of the data (Kerr: personal communication).
  • According to Wittenberg and Pirouz (2013), zero-earners represent a problem only among the LFS’ self-employed due to the simplification of the instrument and increased coverage of informal subsistence workers.
  • This is perhaps the most common approach used by researchers working with household survey data in South Africa.
  • On the other hand, there are 2,824 zero earnings that are flagged as implausible and imputed (see Section 3.7): imputed zero monetary earnings are only slightly lower than observed values, indicating that workers with such characteristics would not earn no monthly wages if they worked in paid employment: in other words, they are implausible records.

3.4 Sample weights

  • While sample weights are usually designed as inverse inclusion probability, Stats SA implements instead a poststratification adjustment based on auxiliary population totals to reflect race, gender, and age group distribution.
  • Due to the cross-sectional nature of the data, post-stratification weighting corrects sampling errors (i.e. non-response rates and out-of-date sampling frame) given the external information available at the particular year in question.
  • Along these lines of thought, Branson (2010) first proposed a cross-entropy estimation approach to create a new set of individual weights—to be common within households—which inflates the sample to a time-consistent external total, while maintaining the post-stratification sampling correction applied by Stats SA.
  • In order to account for higher survival rates and a growing population, PALMSv3.3 updates cross-entropy weights using Stats SA population estimates for 2019.
  • In PALMSv3.3, the variable ‘ceweight1’ is the recommended weight to use in conjunction with realearnings.

3.5 Bracket responses

  • Given that individuals may be reluctant to disclose the exact rand amount that they earn, in many surveys it is customary to offer respondents the option of providing their income information in bands (Juster and Smith 1997).
  • Ardington et al. (2005) claim that bracket incomes are usually higher than those that give point values and show that inequality levels are generally underestimated as a result of collecting income information in bands, although fortunately not by much.
  • This strategy will outperform either imputation whenever the distribution of the variable in question is markedly different from the distributional assumptions implicit in the imputation strategy (earnings follow a log-normal distribution).
  • PALMS’ realearnings variable does not include bracket information, which is instead registered as missing values.
  • The variable bracketweight is the product of 𝑤𝑤𝑖𝑖 (the inverse inclusion probability of a point value response in a particular bracket in a particular wave) and 𝑝𝑝ℎ(the cross-entropy weight for that particular individual created from the Stats SA 2019 demographic model).

3.6 OHS 1996: a special case of bracket responses

  • The 1996 OHS (wave 3 in PALMSv3.3) was a much smaller survey (around 15,000 respondents),11 given that it ran immediately after the census, and it displayed a much simpler instrument than usual since it captured no earnings amounts but only brackets.
  • In the above, Kerr et al. (2019) used five nearest neighbours to draw from.

3.7 Multiple imputations over missing observations

  • Ardington et al. (2005) were the first to implement multiple imputations for missing income values in the South African data.
  • Unlike imputation of (iii) in the previous section, the procedure for filling missing real earnings values in (i), as described in Wittenberg (2017b), requires a preliminary passage, which is: for each wave of the data set, an ordered logit model—with province, gender, education, race, a quadratic in age, and occupation as explanatory variables—is used to impute the brackets.
  • The predicted brackets are then (along with covariates gender and education) used as independent variable in the linear regression to multiply impute rand amounts using PMM, exactly as in the second stage of the OHS 1996 imputation.
  • PALMSv3.3miincomes maintains some of the issues of PALMSv3.3, such as implausibly old workers and different extreme values, such that the authors cannot always make use of the multiple imputations already existing in PALMSv3.3miincomes.
  • 14 MI estimates can be non-replicable in the sense that the estimates one person reports from a sample of m imputed data sets can differ substantially from the estimates that someone else would get if they re-imputed the data and obtained a different sample of M imputed data sets.

3.8 Breaks in the series

  • The South African labour income series is bedevilled by breaks.
  • The earnings question did reappear in late 2009, but data was released only from 2010, in the separate LMDSA (Wittenberg 2017b).
  • The proportion of missing values in each imputation wave does not exceed the 30 per cent of total observations.
  • The imputed data is also checked numerically by generating descriptive statistics.

3.9 Under-reporting

  • A number of studies compare the QLFS earnings data against other sources, particularly administrative data released by the South African Revenue Service since 2011, and suggest that it under-reports high incomes (Bassier and Woolard 2018; Seekings 2007; van der Berg et al.
  • Furthermore, when comparing the wage figures in the QLFS and the SARS data set, Wittenberg (2017b) notes that the gap is relatively uniform, at around 40 per cent, across different deciles.
  • These considerations necessarily imply that the estimate of the Gini coefficient through PALMS in the years 2000–19 will be lower than actually observed, yet higher than estimated through alternative data sources that completely ignore the lower deciles.
  • The problem of under-reporting earnings is inherent to the LFS waves too.
  • It is widely acknowledged that between the last OHS (October 1999) and the first LFS (February 2000), there was an increase in coverage of marginal workers, and a consequent decline in earnings (Kerr and Wittenberg 2019a).

3.10 Quarter frequency (1993–2007)

  • Given the relationship of this paper to subsequent research on the relationship between monetary policy and income inequality, and considering the short timeframe in which monetary policy shocks propagate through the economy, it is necessary to derive sub-annual frequencies (i.e. quarterly) from annual or biannual surveys.
  • Each group will then represent a quarter of the year.
  • This approach is both elementary and simplistic, given that it negates any real shift among quarters.

4 Measuring wage inequality

  • The final step of multiple imputations for missing data is to perform the desired analysis on each mth complete data set, then combine the results of the m analyses from every round, and finally average over the m estimates to obtain a point value with associated standard errors.
  • Figures 4 and 5 show the frequency distribution of real wages across workers with their respective moments, in two distinct points in time: real wages are more evenly distributed in last quarter of 1994 than in the first quarter of 2015.
  • This is confirmed by the Gini index plotted in Figure 6a.
  • In what follows I shall describe the changes in inequality over time and across multiple measures.
  • These figures are based on individual monthly wage income (excluding the self-employed and the unemployed) at gross level (pre-tax).

4.3 The P90/P50 dispersion ratio

  • A similar explanation can be applied to the P90/P50 ratio, the income share of the richest 10 per cent with respect to the lower 50 per cent of the wage distribution.
  • The average ratio is 4.7, which implies that the richest receive five times more income than the poorest.
  • Figure 8 shows a well- defined, positive trend that peaked in the first quarter of 2015.
  • This evidence suggests that the wage differential between the ninth and the fifth decile of the wage distribution has been increasing over time: while the richest have become richer, the wage of the poorest 50 per cent has not increased proportionally.
  • Yet, it seems that P50 changes are more closely related to P90 than P10.

4.4 The generalized entropy index

  • Measures from the generalized entropy (GE) class are sensitive to changes at the higher end of the distribution if the weight given to distances between incomes at different parts of the income distribution is high.
  • The GE index calculated here employs a parameter equal to 2 such that the index is especially sensitive to the existence of large incomes.
  • Figure 9 reveals the worrying presence of high incomes around 2000, while it confirms previous observations over the 2014–16 period.

4.5 Labour share of income

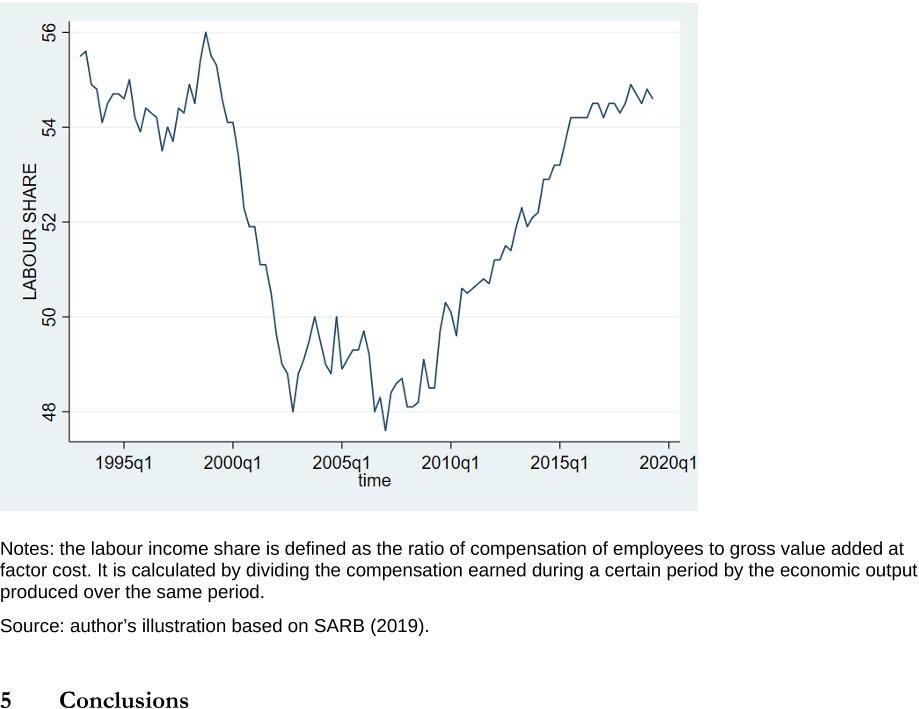
  • In advanced economies a declining labour income share constitutes a major factor in understanding rising inequality, since labour income is more equally distributed than capital income and represents a higher share of total income for lower- and middle-income groups.
  • In post-apartheid South Africa, the share of labour declined while that of capital increased until 2008 .
  • Burger (2015) notes that this happened as a consequence of the widening gap between real wages and labour productivity.
  • Comparing Figure 10 with previous inequality measures, the labour share moves together with inequality suggesting that, given that the lower end of the labour income distribution is structurally unemployed or economically inactive, increasing wages and employment opportunities affect higher incomes relatively more.
  • The functional distribution of income does not seem to be a good proxy for inequality in South Africa.

5 Conclusions

  • A number of problems have been inherited from the primary data used to compile PALMS in the first place, and as such they have no post-fieldwork solution.
  • Inevitably, the time series plotted in Figures 6 to 9 may still feature characteristics that should be ascribed more to methodological than to real variation.
  • 16 Nevertheless, this work contributes to the previous literature on South African disaggregated data by improving existing data quality, delivering a robust time series of labour income inequality among wage employees, and thus facilitating long-run dynamic policy analysis.

Did you find this useful? Give us your feedback

Content maybe subject to copyright    Report

WIDER Working Paper 2020/32
Measuring labour earnings inequality in post-
apartheid South Africa
Serena Merrino*
March 2020

* UNU-WIDER, Helsinki, Finland, and South African Reserve Bank, Pretoria, South Africa; sm147@soas.ac.uk
This study has been prepared within the UNU-WIDER project Southern Africa Towards Inclusive Economic Development
(SA-TIED).
Copyright © UNU-WIDER 2020
Information and requests: publications@wider.unu.edu
ISSN 1798-7237 ISBN 978-92-9256-789-7
https://doi.org/10.35188/UNU-WIDER/2020/789-7
Typescript prepared by Luke Finley.
The United Nations University World Institute for Development Economics Research provides economic analysis and policy
advice with the aim of promoting sustainable and equitable development. The Institute began operations in 1985 in Helsinki,
Finland, as the first research and training centre of the United Nations University. Today it is a unique blend of think tank, research
institute, and UN agencyproviding a range of services from policy advice to governments as well as freely available original
research.
The Institute is funded through income from an endowment fund with additional contributions to its work programme from
Finland, Sweden, and the United Kingdom as well as earmarked contributions for specific projects from a variety of donors.
Katajanokanlaituri 6 B, 00160 Helsinki, Finland
The views expressed in this paper are those of the author(s), and do not necessarily reflect the views of the Institute or the United
Nations University, nor the programme/project donors.
Abstract: This paper investigates the validity of household survey data published by Statistics
South Africa since 1993 and later integrated into the Post-Apartheid Labour Market Series
(PALMS). A series of statistical adjustments are proposed, compared, and applied to primary
data with the purpose of generating time-comparable, unbiased estimates, and accurate standard
errors of labour earnings inequality coefficients. In particular, corrections deal with
outliers and implausible data records, missing observations, bracket responses, breaks in the
series, under-reporting of high incomes, and quarterly frequency. This work lays the ground for
future research on the redistributive dynamics of economic policy in South Africa, which notably
suffers from the presence of spurious shifts in repeated cross-sections.
Key words: income inequality, distribution, heterogeneity, survey data, imputation
JEL classification: C31, D31, O15, R20
Acknowledgements: I am grateful to Professor Laurence Harris for his mentorship, and to the
South African Reserve Bank, in the persons of Dr Chris Loewald and Dr Konstantin Makrelov,
for hosting my field research.

1
1 The Post-Apartheid Labour Market Series
Despite there being a rich literature examining cross-sectional inequality in South Africa, no
consensus has been reached on the quality of long-run time series. In effect, multiple generations
of household surveys have been produced since the end of the apartheid regime by local statistical
and research agenciesfirst and foremost the parastatal Statistics South Africa (Stats SA)which
provide nationally representative micro-level information on the labour market.
1
Although today
these resources constitute an abundant pool of information, they were not originally designed for
dynamic analysis and do not allow for straightforward comparability and immediate use in
longitudinal studies. In other words, the nature of the data collected differs more or less
substantially in each survey wave because of differences in, for example, the sample design
instrument and definitions.
As a response to rising concerns over the validity of using distributional data to undertake time-
comparative exercises, the University of Cape Town’s DataFirst initiated a study of successive
labour market cross-sections and integrated them into a single longitudinal data set. This project
produced the so-called Post-Apartheid Labour Market Series (PALMS): a stacked cross-section
consisting of a harmonized compilation of four household surveys
2
conducted after 1993 and
focused on socioeconomic topics (Kerr et al. 2013). Specifically, PALMS consists of:
The 1993 Project for Statistics on Living Standards and Development (PSLSD); Southern
Africa Labour and Development Research Unit (SALDRU UCT); annual.
The 1994–99 October Household Surveys (OHS); Stats SA; annual.
The 200007 Labour Force Surveys (LFS); Stats SA; biannual (March and September).
The 200818 Quarterly Labour Force Surveys (QLFS); Stats SA; quarterly. QFLS earnings
data are released separately in Labour Market Dynamics (LMDSA).
Notably, the major advantage related to the latest release (PALMS version 3.3) is that it exhibits a
labour income variable at individual level that is consistent from 1993 to 2017.
3
This is labelled
realearnings’ and reports monthly earnings per capita before taxes and at constant prices as for
December 2015. The full description given in Kerr and Wittenberg (2019b: 16) is as follows:
Monthly REAL earnings variable generated from the earnings amount data (not
bracket information) across all waves where earnings amounts were asked and data
have been released (all waves except OHS 1996 and QFLS waves 2008, 2009 and
2012). This is the earnings variable deflated to 2015 Rands using CPI.
For this reason, PALMS has generated a new strand of academic literature that explores the short-
and long-term dynamics of wage inequality in post-transition South Africa, as well as a vibrant
discussion on the need for higher-quality time-consistent and more frequent microeconomic data.
Although PALMS yields significant improvements in the treatment of labour data in South Africa,
1
According to Devereux (1983), until the 1980s, government censuses ignored the personal incomes of black people,
which had to be calculated as a residual of national accounts. For this and other reasons, this paper refers only to the
post-apartheid period.
2
For a detailed description of primary sources available, see Kerr and Wittenberg (2019a).
3
PALMS version 3.3 includes the 2017 LMDSA data on earnings in quarters 3 and 4.

2
it still preserves a number of incongruities inherited from primary sources. To date, the South
African literature that assesses the sensitivity to economic policy shocks of distributional trends is
almost non-existent precisely because dynamic analyses would suffer from the presence of
methodological shortcomings: spurious shifts among repeated cross-sections are inevitably related
to real changes in the variables of interest. It is nonetheless necessary to use available resources to
identify time trends and changes such that a more granular picture can shed light beyond stylized
facts.
This paper investigates the features inherent in PALMS,
4
thoroughly reviews the literature
addressing issues in South African labour data, and complements earlier studies by constructing a
complete and robust time series of inequality to be used for dynamic economic policy analysis.
The ultimate purpose of the paper is to improve longitudinal analysis on inequality in post-
apartheid South Africa by generating unbiased estimates and accurate standard errors of inequality
coefficients that can be better compared over time with quarterly-frequency data. It lays the ground
for a second paper analysing the impact of monetary policy on labour income inequality in South
Africa.
The paper is structured as follows. Section 2 offers a selective review of the literature that makes
use of South African income and earnings disaggregated data. Then, in Section 3, the data
underpinning this work is carefully analysed and different methods of adjustment proposed,
compared, and implemented in defiance of data quality issues. In Section 4, I discuss trends of
inequality through distinct measures based on the moments of the earnings distribution. While it
is not feasible to fully address all problems pertaining to primary data collection, the final remarks
discuss what assumptions are needed in order to make defensible comparisons over time. The final
set of complete data on household-level pre-tax wage income at constant prices, along with the
Stata code that was applied to the raw data, is available from the author on request.
2 Labour income in post-apartheid South Africa: a literature review
A number of attempts to quantify inequality dynamics since the advent of democracy in South
Africa explore the quality of surveys and censuses available in the country and eventually comment
on the comparability of relevant variables over time. Cichello et al. (2005) compare 1993 and 1998
earnings in the KwaZulu Natal Income Dynamics Study and reach different results when using
the data as a panel and as a cross-section. Using the cross-sectional data by overlooking specific
workers’ dynamics shows that formal sector workers were better off in 1998. By contrast, the panel
data indicate that workers who were already employed in the formal sector in 1993 experienced a
fall in earnings, while informal workers started at a much lower average earnings point but
experienced a rise due to mobility towards formal employment. Casale et al. (2004) use only the
OHS 1995 and the LFS 2001:2 to analyse the position of women and ethnic groups in the labour
market. In that paper, the authors make no data transformation and assert thatthese are the years
in which the earnings data are most comparable(Casale et al. 2004: 6). Despite data concerns, they
observe that both mean and median earnings declined over the period. Burger and Yu (2007)
compare the OHS and the LFS from 1995 to 2005 by excluding the outliers, the self-employed,
and informal workers. They find that average earnings started to increase and their distribution to
improve after 1998. Following Casale et al. (2004), their figures confirm no improvements in the
relative earnings position of women, non-white population groups, or unskilled and semi-skilled
4
The relatively long span of data necessary to implement this analysis precludes the use of administrative data recently
released by the South African Revenue Service (SARS), which starts in 2011.

3
workers, but they show signs that there has been an decrease in between-group inequality in more
recent years’. Bhorat et al. (2009) utilize the 1995 Income and Expenditure Survey (IES) and the
2005/06 Income and Expenditure Survey, looking at total income, and report increasing inequality
over the period, from an income Gini coefficient of 0.64 in 1995 to 0.72 in 2005. Leibbrandt et al.
(2010) include all forms of labour earnings from three comparable national household survey data
sets: the PSLSD for 1993, the LFS and IES for 2000, and the National Income Dynamics Study
(NIDS) for 2008. With no adjustment, they calculate the income Gini coefficient in South Africa
and report that it rose from 0.66 in 1993 to 0.68 in 2000 and further to 0.70 in 2008. Finn et al.
(2016) use the first four waves of NIDS from 2008 to 2014 and the 1993 PSLSD to investigate
the shape of the association between parental and child earnings across the distribution.
While all previously mentioned authors rely on a few points in time, the most comprehensive study
on long-run trends in labour income inequality in South Africa can be found in the work of
University of Cape Town’s Martin Wittenberg, which indeed serves as the basis for this discussion.
Wittenberg and Pirouz (2013) use PALMSv2 to show the impact of different types of data quality
adjustments (specifically they treat outliers, zero earnings, bracket responses, and missing
observations) on the estimation of the average wage over the period 19942011. As already
observed by Casale et al. (2004) and Leibbrandt et al. (2010), Wittenberg and Pirouz (2013) also
evidence how the change in coverage between the OHSs and the successive LFSs generated a gap
in the earnings series at the year 2000. Wittenberg and Pirouz conclude by arguing that it is possible
to identify some real wage growth since 2000 despite the noise generated by these measurement
changes. Wittenberg (2014b) builds on the previous paper to compare PALMS to firm-level data
namely the Survey of Employment and Earnings (SEE) and the Quarterly Employment Statistics
(QES) surveys. He adds that the top tail of the earnings distribution has received larger gains than
the 75th percentile; that both of them show significant real earnings growth; that the 10th
percentile made real gains relative to the median, therefore experiencing a compression; and that
among the self-employed there is no evidence for systematic shifts in the distribution over the
post-apartheid period. Wittenberg (2017c) effects further adjustments to yield PALMSv2.1 and
calculates wage inequality through the Gini coefficient. He argues that despite some noise in the
estimates, the measurements made after the LFS 2007:1 are noticeably higher than those made
from 2000 to 2006. Finn (2015) calculates the Gini wage inequality in PALMS using the same data-
cleaning procedure suggested by Wittenberg (2014b): in contrast to Leibbrandt et al. (2010), who
calculated overall income inequality, the Gini coefficient of real wages in 2003:1 (0.553) was almost
identical in 2012:1 (0.554). By contrast, using the LFSs, Vermaak (2012) finds no trend that is
robust to alternative coarse data adjustmentsparticularly the treatment of zero values and the
choice of imputation methods.
3 Working with PALMS
In PALMS, the variable reporting real earnings with no adjustment returns a mean of ZAR8,784
per month and a median of ZAR3,225. The number of observations,

, in the original file
is 963,492; this is higher than in any of the other approaches because every possible earner is
included. However, in the original file more than 5 million real earnings observations are missing,
including all individuals in years 1996, 2008, 2009, and 2018 and the first two quarters of 2019.
Table A1 in the Appendix summarizes the main features of real earnings in PALMSv3.3 before
any adjustment. It can be observed that for each wave the coefficient of variation of the random
variable (standard deviation/mean) is significantly higher than 1: the high variance is due to the
log-normal distribution of real earnings that is not centred on the mean and is positively skewed
with long right tails.

Citations
More filters
Posted Content
TL;DR: Follow-up brackets as discussed by the authors represent partial responses to asset questions and apparently significantly reduce item nonresponse, which is a critical problem with economic survey data, and also provide a remedy to deal with nonignorable nonresponse bias.
Abstract: Missing data are an increasingly important problem in economic surveys, especially when trying to measure household wealth. However, some relatively simple new survey methods such as follow-up brackets appear to appreciably improve the quality of household economic data. Brackets represent partial responses to asset questions and apparently significantly reduce item nonresponse. Brackets also provide a remedy to deal with nonignorable nonresponse bias, a critical problem with economic survey data.

183 citations

01 Oct 2017
TL;DR: Finn et al. as mentioned in this paper acknowledge financial support from the Programme to Support Pro-poor Policy Development and the Department of Planning Monitoring and Evaluation for their doctoral work through the Chair in Poverty and inequality research.
Abstract: Arden Finn: fnnard001@myuct.ac.za, Doctoral student and researcher at the Southern Africa Labour and Development Research Unit, University of Cape Town. Murray Leibbrandt: murray.leibbrandt@uct.ac.za, Professor of economics and director of SALDRU at the University of Cape Town. Vimal Ranchhod: vimal.ranchhod@uct.ac.za, Associate professor in SALDRU at the University of Cape Town. Acknowledgements: All authors acknowledge financial support from the Programme to Support Pro-poor Policy Development in the Department of Planning Monitoring and Evaluation. Arden Finn acknowledges the National Research Foundation for financial support for his doctoral work through the Chair in Poverty and Inequality Research. Murray Leibbrandt acknowledges the Research Chairs Initiative of the Department of Science and Technology and National Research Foundation for funding his work as the Chair in Poverty and Inequality Research. Vimal Ranchhod acknowledges support from the Research Chairs Initiative of the Department of Science and Technology and the National Research Foundation.

7 citations

Journal ArticleDOI
TL;DR: In this paper , the authors assess the subjective interlinkages between subjective social status, inequality perceptions and demand for redistribution in South Africa, the country with the highest level of inequality in the world.
Abstract: Abstract The international literature shows that demand for redistribution is influenced by subjective factors like perceptions of inequality and individuals’ perceived social status. However, few have assessed these subjective dynamics in the developing South, especially in Africa. This study aims to assess the subjective interlinkages between subjective social status, inequality perceptions and demand for redistribution in South Africa, the country with the highest level of inequality in the world. Using ISSP data and an ordered probit model, we show that subjective social status is a negative and significant determinant of demand for redistribution in South Africa. This means that South Africans who position themselves on the lower rungs of society demand higher redistribution and vice versa. Furthermore, perceptions of inequality are significant in driving demand for redistribution in South Africa, as this study finds that inequality tolerance negatively influences demand for redistribution and perceptions of actual inequality positively influence demand for redistribution. This means that South Africans who perceive higher levels of inequality tend to demand more redistribution, while South Africans who tolerate more inequality tend to demand less redistribution. Surprisingly, inequality tolerance is relatively high among the unemployed, Africans, and females. Many of these individuals are part of the most vulnerable in society and would actually benefit from more redistribution. Overall, the results show that, in South Africa, subjective factors like subjective social status and attitudes towards inequality significantly influence demand for redistribution.

1 citations

BookDOI
TL;DR: In this article, the effect of monetary policy shocks on wage inequality through the earnings heterogeneity channel under the inflation-targeting regime implemented in South Africa since 2000 was investigated. And the empirical contribution follows previous studies by implementing a multivariate time-series analysis and identifying the structural shocks in a vector error correction model.
Abstract: This paper aims at providing new evidence over the effect of conventional monetary policy shocks on wage inequality through the earnings heterogeneity channel under the inflation-targeting regime implemented in South Africa since 2000. The empirical contribution follows previous studies by implementing a multivariate time-series analysis and identifying the structural shocks in a vector error correction model. Impulse response functions show that the overall wage distribution worsens immediately after a positive shock to the prime rate.

1 citations


Cites background or methods from "Measuring labour earnings inequalit..."

  • ...4 This section relies heavily on my previous work (Merrino 2020)....

    [...]

  • ...If this is the case, the functional distribution of income remains overall an inadequate proxy for labour income inequality in the South African case (Merrino 2020)....

    [...]

  • ...By looking at the evolution of the labour share in the post-apartheid era, it emerges that it has been moving in the same direction as wage inequality (Merrino 2020)....

    [...]

BookDOI
TL;DR: In this paper, the authors use a dynamic perspective to show the linkages between persistent effects of discrimination in the labour market and the efficacy of redistributive fiscal policy in reducing inequality.
Abstract: Inequality in South Africa is the enduring legacy of racial discrimination. We use a dynamic perspective to show the linkages between persistent effects of discrimination in the labour market and the efficacy of redistributive fiscal policy in reducing inequality. We present a machine-learning analysis based on household survey data in the Post-Apartheid Labour Market Series to predict the main drivers of the relationship between workers' heterogeneous socioeconomic characteristics, the behaviour of variables related to labour market status, and labour income inequality.

1 citations


Cites methods from "Measuring labour earnings inequalit..."

  • ...This analysis exploits the recent improvement of the household survey data integrated in the Post-Apartheid Labour Market Series (PALMS), which allows a reliable comparison over time of inequality measures (Merrino 2020)....

    [...]

  • ...The harmonized data include the Household Surveys from 1994 to 1999, the Labour Force Surveys from 2000 to 2007, and the Quarterly Labour Force Surveys from 2008 to 2019 (see Finn and Leibbrandt 2018; Kerr and Wittenberg 2019; Merrino 2020)....

    [...]

References
More filters
Journal ArticleDOI
01 Jun 1987

183 citations


"Measuring labour earnings inequalit..." refers methods in this paper

  • ...The process of PMM imputation is repeated m times to obtain m imputed data sets to be eventually analysed as though they were complete (Rubin 1987)....

    [...]

Journal ArticleDOI
TL;DR: Follow-up brackets as discussed by the authors represent partial responses to asset questions and apparently significantly reduce item nonresponse, which is a critical problem with economic survey data, and also provide a remedy to deal with nonignorable nonresponse bias.
Abstract: Missing data are an increasingly important problem in economic surveys, especially when trying to measure household wealth. However, some relatively simple new survey methods such as follow-up brackets appear to appreciably improve the quality of household economic data. Brackets represent partial responses to asset questions and apparently significantly reduce item nonresponse. Brackets also provide a remedy to deal with nonignorable nonresponse bias, a critical problem with economic survey data.

179 citations

Journal ArticleDOI
TL;DR: In this paper, the authors investigated labour market trends in South Africa between October 1995 and March 2003 and found an almost two million net increase in employment, but this increase is likely to have been inflated by changes in data capture and definitions of employment over the years and that the real increase may be considerably less, with a lower bound of approximately 1.4 million jobs.
Abstract: In this paper we investigate labour market trends in South Africa between October 1995 and March 2003. In particular, we evaluate the South African governments claim that over this period, the economy created two million net new jobs. Using the same household survey data as that used to generate official employment estimates, we also find an almost two million net increase in employment. However, we show that this increase is likely to have been inflated by changes in data capture and definitions of employment over the years, and that the real increase may be considerably less, with a lower bound of approximately 1.4 million jobs. We argue further that the rise in employment over the period must be evaluated in the context of a dramatically larger growth in labour supply and therefore rising rates of unemployment, declining real earnings, and an increase in the number of the working poor, particularly among Africans. (This abstract was borrowed from another version of this item.)

151 citations


"Measuring labour earnings inequalit..." refers background or methods or result in this paper

  • ...As already observed by Casale et al. (2004) and Leibbrandt et al. (2010), Wittenberg and Pirouz (2013) also evidence how the change in coverage between the OHSs and the successive LFSs generated a gap in the earnings series at the year 2000. Wittenberg and Pirouz conclude by arguing that it is possible to identify some real wage growth since 2000 despite the noise generated by these measurement changes. Wittenberg (2014b) builds on the previous paper to compare PALMS to firm-level data— namely the Survey of Employment and Earnings (SEE) and the Quarterly Employment Statistics (QES) surveys....

    [...]

  • ...However, as the demographic information contained in new censuses changes, later surveys are calibrated to previous aggregates that have become obsolete (Branson and Wittenberg 2014; Casale et al. 2004)....

    [...]

  • ...Casale et al. (2004) use only the OHS 1995 and the LFS 2001:2 to analyse the position of women and ethnic groups in the labour market....

    [...]

  • ...As already observed by Casale et al. (2004) and Leibbrandt et al. (2010), Wittenberg and Pirouz (2013) also evidence how the change in coverage between the OHSs and the successive LFSs generated a gap in the earnings series at the year 2000. Wittenberg and Pirouz conclude by arguing that it is possible to identify some real wage growth since 2000 despite the noise generated by these measurement changes. Wittenberg (2014b) builds on the previous paper to compare PALMS to firm-level data— namely the Survey of Employment and Earnings (SEE) and the Quarterly Employment Statistics (QES) surveys. He adds that the top tail of the earnings distribution has received larger gains than the 75th percentile; that both of them show significant real earnings growth; that the 10th percentile made real gains relative to the median, therefore experiencing a compression; and that among the self-employed there is no evidence for systematic shifts in the distribution over the post-apartheid period. Wittenberg (2017c) effects further adjustments to yield PALMSv2....

    [...]

  • ...As already observed by Casale et al. (2004) and Leibbrandt et al....

    [...]

01 Jan 2007
TL;DR: The reality has been disappointing: despite steady economic growth, income poverty probably rose in the late 1990s before a muted decline in the early 2000s, income inequality has probably grown, and life expectancy has declined.
Abstract: Democratic South Africa was born amidst high hopes for the reduction of income poverty and inequality from their high levels under apartheid. The reality has been disappointing: despite steady economic growth, income poverty probably rose in the late 1990s before a muted decline in the early 2000s, income inequality has probably grown, and life expectancy has declined. The proximate causes are clear: persistent unemployment and low demand for unskilled labour, strong demand for skilled labour, an unequal education system, and a social safety net that is unusually widespread but nonetheless has large holes. It is also clear that economic growth alone will not reduce poverty or inequality. Pro-poor social policies are important, but not as important as a pro-poor economic growth path. Unfortunately, there is little sign of the political conditions changing to push the state towards the promotion of a more pro-poor pattern of economic growth. There is some chance of parametric reforms of the welfare state. Overall, however, it is likely that, after another ten years of democracy, unemployment and poverty rates will remain high, despite significant redistribution through cash transfers, and incomes will continue to be distributed extremely unequally.

97 citations


"Measuring labour earnings inequalit..." refers background or result in this paper

  • ...While all previously mentioned authors rely on a few points in time, the most comprehensive study on long-run trends in labour income inequality in South Africa can be found in the work of University of Cape Town’s Martin Wittenberg, which indeed serves as the basis for this discussion. Wittenberg and Pirouz (2013) use PALMSv2 to show the impact of different types of data quality adjustments (specifically they treat outliers, zero earnings, bracket responses, and missing observations) on the estimation of the average wage over the period 1994–2011....

    [...]

  • ...A number of studies compare the QLFS earnings data against other sources, particularly administrative data released by the South African Revenue Service since 2011, and suggest that it under-reports high incomes (Bassier and Woolard 2018; Seekings 2007; van der Berg et al. 2007; Wittenberg 2014a, 2017a)....

    [...]

  • ...…of studies compare the QLFS earnings data against other sources, particularly administrative data released by the South African Revenue Service since 2011, and suggest that it under-reports high incomes (Bassier and Woolard 2018; Seekings 2007; van der Berg et al. 2007; Wittenberg 2014a, 2017a)....

    [...]

  • ...While all previously mentioned authors rely on a few points in time, the most comprehensive study on long-run trends in labour income inequality in South Africa can be found in the work of University of Cape Town’s Martin Wittenberg, which indeed serves as the basis for this discussion....

    [...]

Journal ArticleDOI
TL;DR: In this paper, the authors make use of a regional panel data set for KwaZulu-Natal to begin the study of earnings and employment dynamics, and find that on average, working-aged Africans experienced large gains in earnings during the period 1993-8.
Abstract: The labour market is central in determining individual and household well-being in South Africa. Therefore, an understanding of earnings and employment dynamics is a key policy issue. However, the absence of panel data has constrained empirical work addressing these issues. This paper makes use of a regional panel data set for KwaZulu-Natal to begin the study of earnings and employment dynamics. The authors find that, on average, working-aged Africans in KwaZulu-Natal experienced large gains in earnings during the period 1993--8. These gains were progressive in nature, with the highest quintile of 1993 earners and those originally employed in the formal sector actually experiencing zero or negative growth in their average earnings. The average gain in earnings varied substantially depending on the employment transitions experienced by labour force participants. Obtaining formal sector employment is found to be an important pathway to growth in earnings, yet not exclusively so. The majority of those who get ahead do so by retaining employment in a given sector or moving into the informal sector. The dynamism of the informal sector over this period is shown to be an important contributor to the progressive growth in earnings. Government policies that seek to increase employment and earnings in the informal as well as formal sectors are recommended. Understanding the constraints preventing the vast number of unemployed from engaging in informal employment is shown to be a key issue for future work. Copyright 2005, Oxford University Press.

63 citations


"Measuring labour earnings inequalit..." refers result in this paper

  • ...Cichello et al. (2005) compare 1993 and 1998 earnings in the KwaZulu Natal Income Dynamics Study and reach different results when using the data as a panel and as a cross-section....

    [...]

Frequently Asked Questions (1)
Q1. What are the contributions mentioned in the paper "Wider working paper 2020/32-measuring labour earnings inequality in post-apartheid south africa" ?

In this paper, a robust time series of labour income inequality among wage employees is presented to facilitate long-run dynamic policy analysis.