
All figures (18)

Fig. 1: While previous object recognition datasets have focused on (a) image classification, (b) object bounding box localization or (c) semantic pixel-level segmentation, we focus on (d) segmenting individual object instances. We introduce a large, richly-annotated dataset comprised of images depicting complex everyday scenes of common objects in their natural context. 
Fig. 10: User interfaces for non-iconic image collection. (a) Interface for selecting non-iconic images containing pairs of objects. (b) Interface for selecting non-iconic images for categories that rarely co-occurred with others. 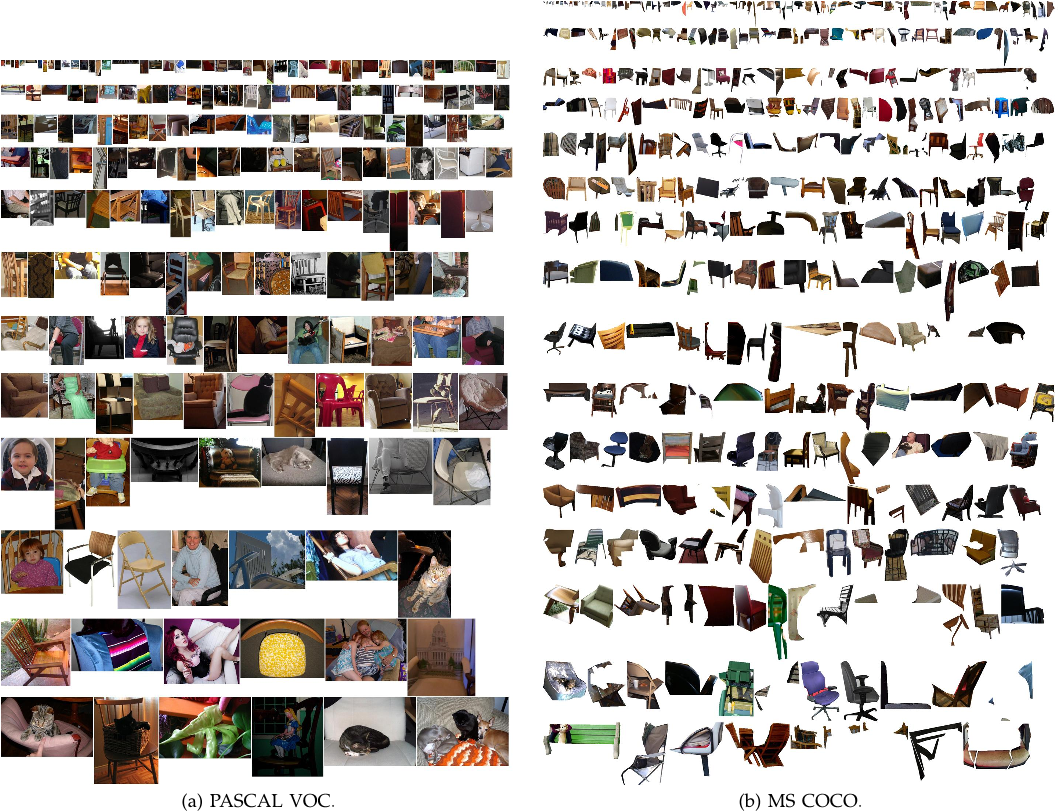
Fig. 14: Random chair instances from PASCAL VOC and MS COCO. At most one instance is sampled per image. 
TABLE 3: Scene category list. 
Fig. 15: Examples of borderline segmentations that passed (top) or were rejected (bottom) in the verification stage. 
Fig. 5: (a) Number of annotated instances per category for MS COCO and PASCAL VOC. (b,c) Number of annotated categories and annotated instances, respectively, per image for MS COCO, ImageNet Detection, PASCAL VOC and SUN (average number of categories and instances are shown in parentheses). (d) Number of categories vs. the number of instances per category for a number of popular object recognition datasets. (e) The distribution of instance sizes for the MS COCO, ImageNet Detection, PASCAL VOC and SUN datasets. 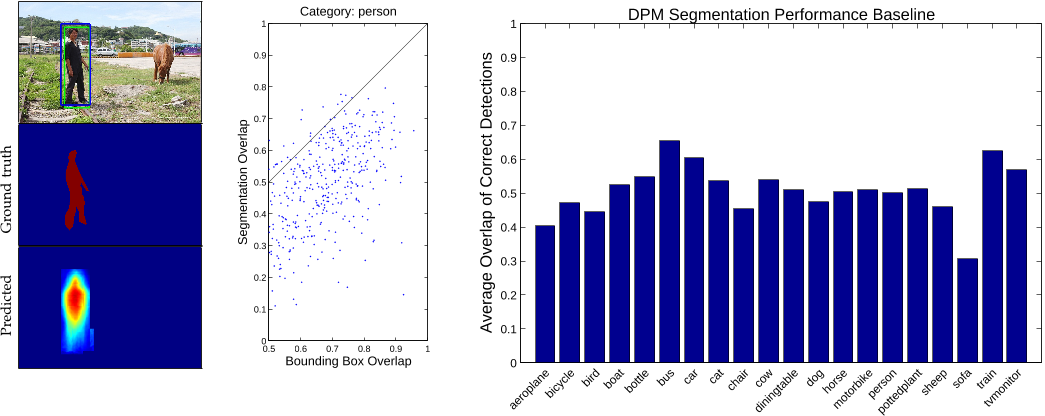
Fig. 9: A predicted segmentation might not recover object detail even though detection and ground truth bounding boxes overlap well (left). Sampling from the person category illustrates that predicting segmentations from topdown projection of DPM part masks is difficult even for correct detections (center). Average segmentation overlap measured on MS COCO for the 20 PASCAL VOC categories demonstrates the difficulty of the problem (right). 
TABLE 2: Candidate category list (272). Bold: selected categories (91). Bold∗: omitted categories in 2014 release (11). 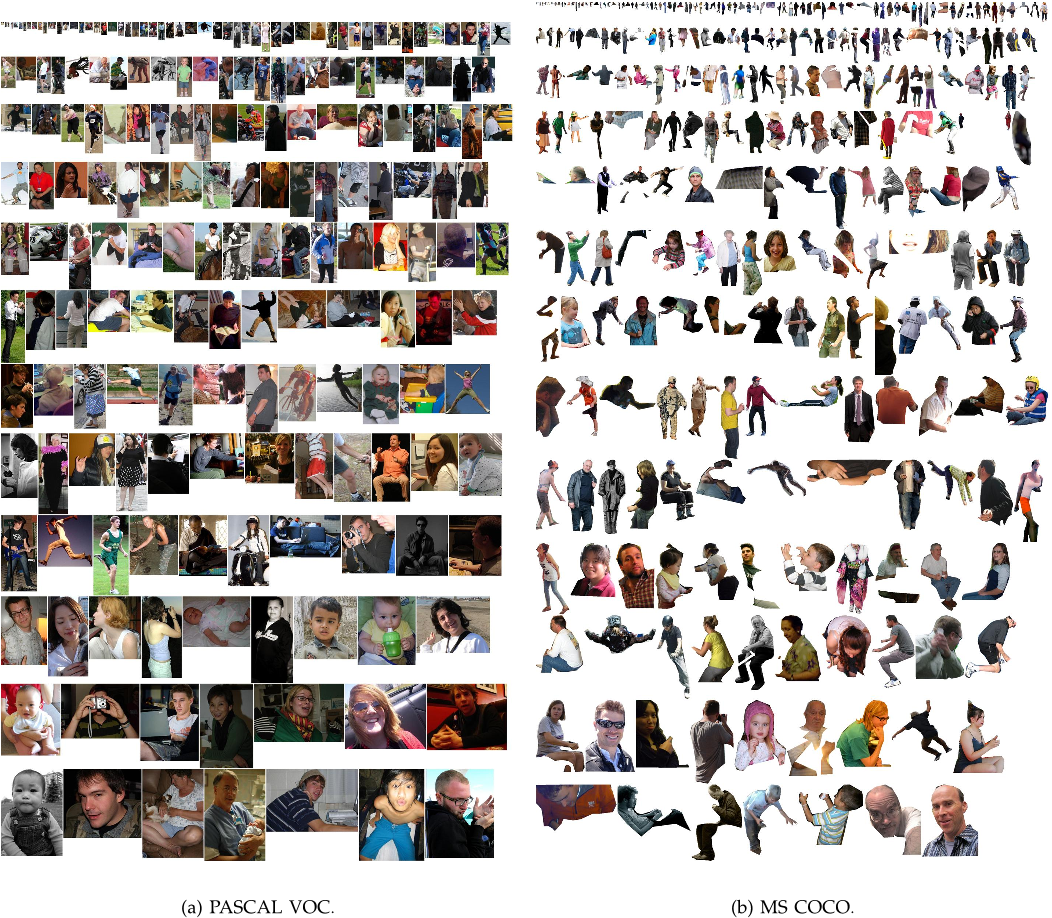
Fig. 13: Random person instances from PASCAL VOC and MS COCO. At most one instance is sampled per image. 
Fig. 2: Example of (a) iconic object images, (b) iconic scene images, and (c) non-iconic images. 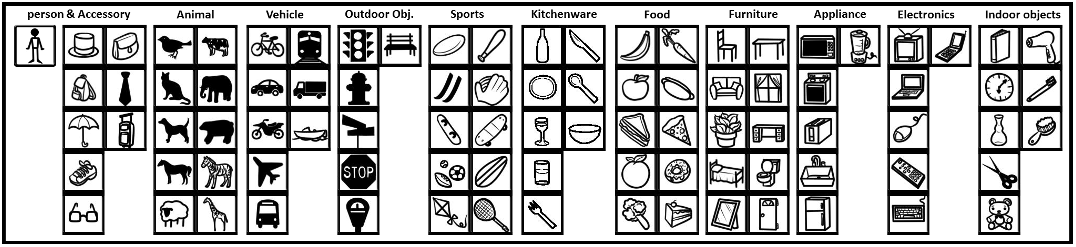
Fig. 11: Icons of 91 categories in the MS COCO dataset grouped by 11 super-categories. We use these icons in our annotation pipeline to help workers quickly reference the indicated object category. 
Fig. 12: User interfaces for collecting instance annotations, see text for details. 
Fig. 6: Samples of annotated images in the MS COCO dataset. 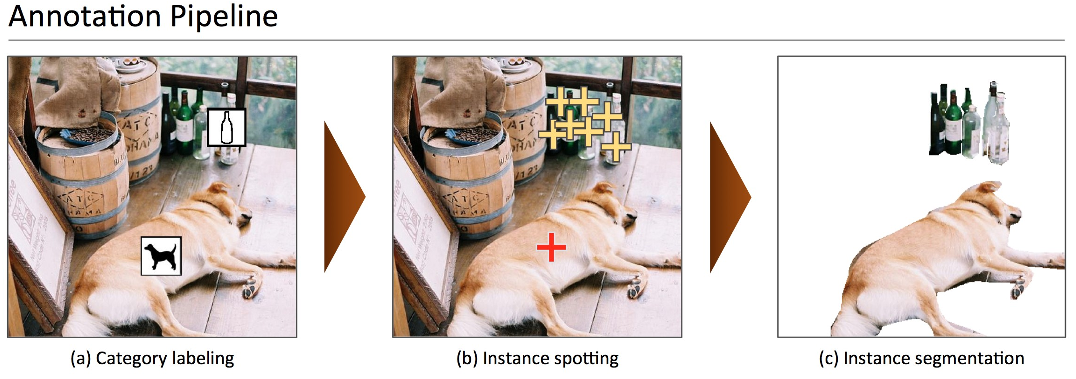
Fig. 3: Our annotation pipeline is split into 3 primary tasks: (a) labeling the categories present in the image (§4.1), (b) locating and marking all instances of the labeled categories (§4.2), and (c) segmenting each object instance (§4.3). ![TABLE 1: Top: Detection performance evaluated on PASCAL VOC 2012. DPMv5-P is the performance reported by Girshick et al. in VOC release 5. DPMv5-C uses the same implementation, but is trained with MS COCO. Bottom: Performance evaluated on MS COCO for DPM models trained with PASCAL VOC 2012 (DPMv5-P) and MS COCO (DPMv5-C). For DPMv5-C we used 5000 positive and 10000 negative training examples. While MS COCO is considerably more challenging than PASCAL, use of more training data coupled with more sophisticated approaches [5], [6], [7] should improve performance substantially.](/figures/table-1-top-detection-performance-evaluated-on-pascal-voc-1sypmu73.png)
TABLE 1: Top: Detection performance evaluated on PASCAL VOC 2012. DPMv5-P is the performance reported by Girshick et al. in VOC release 5. DPMv5-C uses the same implementation, but is trained with MS COCO. Bottom: Performance evaluated on MS COCO for DPM models trained with PASCAL VOC 2012 (DPMv5-P) and MS COCO (DPMv5-C). For DPMv5-C we used 5000 positive and 10000 negative training examples. While MS COCO is considerably more challenging than PASCAL, use of more training data coupled with more sophisticated approaches [5], [6], [7] should improve performance substantially. 
Fig. 8: Evaluating instance detections with segmentation masks versus bounding boxes. Bounding boxes are a particularly crude approximation for articulated objects; in this case, the majority of the pixels in the (blue) tightfitting bounding-box do not lie on the object. Our (green) instance-level segmentation masks allows for a more accurate measure of object detection and localization. 
Fig. 7: We visualize our mixture-specific shape masks. We paste thresholded shape masks on each candidate detection to generate candidate segments. 
Fig. 4: Worker precision and recall for the category labeling task. (a) The union of multiple AMT workers (blue) has better recall than any expert (red). Ground truth was computed using majority vote of the experts. (b) Shows the number of workers (circle size) and average number of jobs per worker (circle color) for each precision/recall range. Most workers have high precision; such workers generally also complete more jobs. For this plot ground truth for each worker is the union of responses from all other AMT workers. See §4.4 for details.


![TABLE 1: Top: Detection performance evaluated on PASCAL VOC 2012. DPMv5-P is the performance reported by Girshick et al. in VOC release 5. DPMv5-C uses the same implementation, but is trained with MS COCO. Bottom: Performance evaluated on MS COCO for DPM models trained with PASCAL VOC 2012 (DPMv5-P) and MS COCO (DPMv5-C). For DPMv5-C we used 5000 positive and 10000 negative training examples. While MS COCO is considerably more challenging than PASCAL, use of more training data coupled with more sophisticated approaches [5], [6], [7] should improve performance substantially.](/figures/table-1-top-detection-performance-evaluated-on-pascal-voc-1sypmu73.webp)


06 Sep 2014-