scispace - formally typeset
Open AccessPosted ContentDOI

Modeling long-term fire impact on ecosystem characteristics and surface energy using a process-based vegetation–fire model SSiB4/TRIFFID-Fire v1.0

Reads0
Chats0
TLDR
In this article, a fire model of intermediate complexity to a biophysical model with dynamic vegetation, SSiB4/TRIFFID (The Simplified Simple Biosphere Model coupled with the Top-down Representation of Interactive Foliage and Flora Including Dynamics Model), is used to simulate the burned area during 1948-2014.
Abstract
. Fire is one of the primary disturbances to the distribution and ecological properties of the world’s major biomes and can influence the surface fluxes and climate through vegetation-climate interactions. This study incorporates a fire model of intermediate complexity to a biophysical model with dynamic vegetation, SSiB4/TRIFFID (The Simplified Simple Biosphere Model coupled with the Top-down Representation of Interactive Foliage and Flora Including Dynamics Model). This new model, SSiB4/TRIFFID-Fire, updating fire impact on the terrestrial carbon cycle every 10 days, is then used to simulate the burned area during 1948–2014. The simulated global burned area in 2000–2014 is 471.9 Mha yr−1, close to the estimate, 478.1 Mha yr−1, in Global Fire Emission Database v4s (GFED4s) with a spatial correlation of 0.8. The SSiB4/TRIFFID-Fire reproduces temporal variations of the burned area at monthly to interannual scales. Specifically, it captures the observed decline trend in northern African savanna fire and accurately simulates the fire seasonality in most major fire regions. The simulated fire carbon emission is 2.19 Pg yr−1, slightly higher than the GFED4s (2.07 Pg yr−1). The SSiB4/TRIFFID-Fire is applied to assess long-term fire impact on ecosystem characteristics and surface energy budget by comparing model runs with and without fire (FIRE-ON minus FIRE-OFF). The FIRE-ON simulation reduces tree cover over 6.14 % of the global land surface, accompanied by a decrease in leaf area index and vegetation height by 0.13 m2 m−2 and 1.27 m, respectively. The surface albedo and sensible heat are reduced throughout the year, while latent heat flux decreases in the fire season but increases in the rainy season. Fire results in an increase in surface temperature over most fire regions.

read more

Content maybe subject to copyright    Report

Geosci. Model Dev., 13, 6029–6050, 2020
https://doi.org/10.5194/gmd-13-6029-2020
© Author(s) 2020. This work is distributed under
the Creative Commons Attribution 4.0 License.
Modeling long-term fire impact on ecosystem characteristics and
surface energy using a process-based vegetation–fire
model SSiB4/TRIFFID-Fire v1.0
Huilin Huang
1
, Yongkang Xue
1,2
, Fang Li
3
, and Ye Liu
1
1
Department of Geography, University of California, Los Angeles, CA 90095, USA
2
Department of Atmospheric & Oceanic Sciences, University of California, Los Angeles, CA 90095, USA
3
International Center for Climate and Environmental Sciences, Institute of Atmospheric Physics,
Chinese Academy of Sciences, Beijing, China
Correspondence: Yongkang Xue (yxue@geog.ucla.edu)
Received: 26 April 2020 Discussion started: 15 June 2020
Revised: 19 September 2020 Accepted: 16 October 2020 Published: 2 December 2020
Abstract. Fire is one of the primary disturbances to the
distribution and ecological properties of the world’s ma-
jor biomes and can influence the surface fluxes and climate
through vegetation–climate interactions. This study incorpo-
rates a fire model of intermediate complexity to a biophys-
ical model with dynamic vegetation, SSiB4/TRIFFID (The
Simplified Simple Biosphere Model coupled with the Top-
down Representation of Interactive Foliage and Flora Includ-
ing Dynamics Model). This new model, SSiB4/TRIFFID-
Fire, updating fire impact on the terrestrial carbon cycle ev-
ery 10 d, is then used to simulate the burned area during
1948–2014. The simulated global burned area in 2000–2014
is 471.9 Mha yr
1
, close to the estimate of 478.1 Mha yr
1
in Global Fire Emission Database v4s (GFED4s), with a spa-
tial correlation of 0.8. The SSiB4/TRIFFID-Fire reproduces
temporal variations of the burned area at monthly to inter-
annual scales. Specifically, it captures the observed decline
trend in northern African savanna fire and accurately simu-
lates the fire seasonality in most major fire regions. The sim-
ulated fire carbon emission is 2.19 Pg yr
1
, slightly higher
than the GFED4s (2.07 Pg yr
1
).
The SSiB4/TRIFFID-Fire is applied to assess the long-
term fire impact on ecosystem characteristics and surface en-
ergy budget by comparing model runs with and without fire
(FIRE-ON minus FIRE-OFF). The FIRE-ON simulation re-
duces tree cover over 4.5 % of the global land surface, ac-
companied by a decrease in leaf area index and vegetation
height by 0.10 m
2
m
2
and 1.24 m, respectively. The surface
albedo and sensible heat are reduced throughout the year,
while latent heat flux decreases in the fire season but in-
creases in the rainy season. Fire results in an increase in sur-
face temperature over most fire regions.
1 Introduction
Wildfire, whether natural or human-made, is one of the pri-
mary ecosystem disturbances and it plays a major role in the
terrestrial biogeochemical cycles and ecological succession
across spatial and temporal scales (Sousa, 1984; Bowman et
al., 2009). Every year in the dry season, wildfires burn about
400 Mha of land vegetated areas, leaving behind numerous
scars in the landscape (Giglio et al., 2013; Chuvieco et al.,
2016). Fires affect the climate through modification of wa-
ter, energy, and momentum exchange between land and at-
mosphere (Chambers and Chapin, 2002; Bond-Lamberty et
al., 2009) and can interact with monsoons by affecting at-
mospheric circulations (De Sales et al., 2016; Saha et al.,
2016). Fires are also important sources of global carbon,
aerosols, and trace gas emissions. Based on the latest satel-
lite estimates, global fires emit 1.5–4.2 Pg C yr
1
carbon, 7–
8.2 Pg C yr
1
CO
2
, and 1.9–6.0 Tg C yr
1
black carbon to
the atmosphere (Chuvieco et al., 2016; van der Werf et al.,
2017; Li et al., 2019). Fire emissions contribute to increases
in greenhouse gases and cloud condensation nuclei through
geochemistry processes (Scholes et al., 1996), affecting ra-
diative forcing, the hydrology cycle (Ward et al., 2012; Jiang
Published by Copernicus Publications on behalf of the European Geosciences Union.

6030 H. Huang et al.: Modeling long-term fire impact on ecosystem characteristics
et al., 2016; Hamilton et al., 2018), and air quality (van der
Werf et al., 2010; Johnston et al., 2012).
Since the early 2000s, fire models have been developed
within Dynamic Global Vegetation Models (DGVMs) to ex-
plicitly describe the burned area, fire emissions, and fire dis-
turbance on terrestrial ecosystems (Thonicke et al., 2001;
Venevsky et al., 2002; Arora and Boer, 2005; Thonicke et
al., 2010; Li et al., 2012; Pfeiffer et al., 2013; Lasslop et al.,
2014; Yue et al., 2014; Rabin et al., 2018; Burton et al., 2019;
Venevsky et al., 2019). These fire models have various lev-
els of complexity, from simple statistical models (SIMFIRE;
Knorr et al., 2016) to complicated process-based ones such
as SPITFIRE (Thonicke et al., 2010) and MC2 (Bachelet et
al., 2015). With increasing complexity, more fire processes
and fire characteristics are considered in fire models. In gen-
eral, current fire models broadly capture the global amounts
and spatial distribution of burned area and carbon emissions,
as compared to different observations. However, many em-
pirically determined parameters are included in the compli-
cated process-based models, which leads to large uncertain-
ties. There is no model that outperforms other models across
all fire variables (Hantson et al., 2020). Moreover, current fire
models have deficiencies in simulating the peak fire month,
fire season length, and interannual variability, as reported by
the Fire Model Intercomparison Project (FireMIP; Hantson
et al., 2020; Li et al., 2019). Most fire models show a 1–2
month shift in peak burned area and simulate a longer fire
season compared to observations.
Fire models have been used to reconstruct fire history be-
fore the satellite era (Yang et al., 2015; van Marle et al., 2017;
Li et al., 2019). In addition, they are widely used to attribute
historical variability of burned area to various climate and
anthropogenic driving factors (Kloster et al., 2012; Andela
et al., 2017; Forkel et al., 2019; Teckentrup et al., 2019).
Some fire models have been used to assess long-term fire im-
pact on the terrestrial carbon cycle by comparing a reference
simulation with fire and a sensitivity simulation representing
“a world without fire”. However, the simulated responses of
vegetation and carbon cycle are divergent. Bond et al. (2005)
reported that forest cover would double in a world without
fire, while in the recent fire-coupled DGVMs, a much smaller
tree cover reduction by 10 % (ranges between 3 % and 25 %)
is simulated when fire is taken into account (Lasslop et al.,
2020). Earlier model-based studies reported that fire reduced
terrestrial carbon uptake. However, the range of the quan-
tified reduction was fairly broad (0.05–3.60 Pg C yr
1
), and
most studies did not consider the fire effects on vegetation
distribution and related mechanisms (Li et al., 2014; Yue et
al., 2015; Poulter et al., 2015; Yang et al., 2015; Seo and Kim,
2019; Zou et al. 2020).
Thus far, only the fire model developed by Li et al. (2012,
2013) has been used to investigate the long-term fire effects
on surface energy. By comparing the simulated climate with
and without fire, Li et al. (2017) concluded that fire caused
a significant decrease in surface radiation, latent heat, and
a slight decrease in sensible heat fluxes through changes in
biophysical properties such as albedo, Bowen ratio, and aero-
dynamic resistance. An increase in surface temperature was
found over most fire regions. However, the long-term fire im-
pact on vegetation distribution was not taken into account in
Li et al. (2017), which has been widely observed on site-level
studies (Higgins et al., 2007; Smit et al., 2010) and can cause
substantial changes in aerodynamic resistance due to conver-
sions of dominant plant functional type (PFT) (Huang et al.,
2020b). Moreover, Li et al. (2017) focused on the annual fire
impact on energy fluxes. However, fire’s effects on energy
budget can have large seasonal variations associated with the
vegetation loss during the fire seasons and vegetation recov-
ery during post-fire rainy seasons. The seasonal variations in
fire effects have not been investigated in any fire studies.
In the original SSiB4/TRIFFID, the carbon disturbance
caused by fire and insects was assumed to be a constant,
which depended solely on PFT without spatial and tempo-
ral changes (Cox et al., 2001; Liu et al., 2019). However,
the fire disturbance is varies greatly with climate, vegeta-
tion productivity, and socioeconomic conditions, which has
a strong influence on vegetation dynamics, carbon cycling,
and soil processes. In this study, we develop the fire mod-
eling by incorporating the fire scheme of Li et al. (2012,
2013) to SSiB4/TRIFFID (hereafter, SSiB4/TRIFFID-Fire).
The SSiB4/TRIFFID-Fire model updates fire-induced carbon
loss every 10 d, which has been rarely employed in current
process-based fire models, and is used to provide a quanti-
tative assessment of fire impact on ecosystem characteristics
and surface energy at subseasonal, seasonal, interannual, and
long-term scales. Specifically, our objectives are (1) to evalu-
ate the climatology and interannual variability of burned area
and carbon emissions simulated by offline SSiB4/TRIFFID-
Fire, (2) to assess the ability of SSiB4/TRIFFID-Fire in cap-
turing the fire seasonality in major fire regions, and (3) to
assess the long-term fire impact on PFT distribution and veg-
etation properties and the resultant changes in seasonal sur-
face energy budget and temperature. In Sect. 2, we provide
a brief description of the DGVM, SSiB4/TRIFFID; the fire
model, taken from Li et al. (2012, 2013); and the coupling
procedures. The experimental design and data for model in-
put and validation are introduced in Sect. 3. The fire model
evaluation on a global scale and the application of long-term
fire impact on ecosystem characteristics and surface proper-
ties are presented in Sect. 4. Discussions and conclusions are
given in Sect. 5.
2 Method
2.1 Land and vegetation model
The Simplified Simple Biosphere Model (SSiB, Xue et al.,
1991; Zhan et al., 2003) is a biophysical model which sim-
ulates fluxes of surface radiation, momentum, sensible and
Geosci. Model Dev., 13, 6029–6050, 2020 https://doi.org/10.5194/gmd-13-6029-2020

H. Huang et al.: Modeling long-term fire impact on ecosystem characteristics 6031
latent heat, runoff, soil moisture, surface temperature, and
vegetation gross and net primary productivity (GPP and
NPP) based on energy and water balance. The SSiB was
coupled with a dynamic vegetation model, the Top-down
Representation of Interactive Foliage and Flora Including
Dynamics Model (TRIFFID), to calculate leaf area index
(LAI), canopy height, and PFT fractional coverage accord-
ing to the carbon balance (Cox, 2001; Zhang et al., 2015;
Harper et al., 2016; Liu et al., 2019). We have improved
the PFT competition strategy and plant physiology processes
to make the SSiB4/TRIFFID suitable for seasonal, interan-
nual, and decadal studies (Zhang et al., 2015; Liu et al.,
2019). SSiB4/TRIFFID includes seven PFTs: (1) broadleaf
evergreen trees (BET), (2) needleleaf evergreen trees (NET),
(3) broadleaf deciduous trees (BDT), (4) C
3
grasses, (5) C
4
plants, (6) shrubs, and (7) tundra. The coverage of a PFT is
determined by net carbon availability, competition between
species, and disturbance, which implicitly includes mortal-
ity due to fires, pests, and windthrow. A detailed description
and validation of SSiB4/TRIFFID can be found in Zhang et
al. (2015) and Liu et al. (2019).
2.2 Fire model and modifications
In this study, a process-based fire model of intermediate
complexity has been implemented in the SSiB4/TRIFFID,
called SSiB4/TRIFFID-Fire. The fire model developed by
Li et al. (2012, 2013) was first built on the model platform
of CLM-DGVM and has been incorporated in IAP-DGVM
(Zeng et al., 2014), CLM4.5 (Oleson et al., 2013), CLM5
(Lawrence et al., 2019), LM3 in Earth system model GFDL-
ESM (Rabin et al., 2018; Ward et al., 2018), AVIM in Cli-
mate System Model BCC-CSM (Weiping Li, personal com-
munication, 2016), E3SM Land Model (ELM; Ricciuto et al.,
2018), NASA GEOS catchment-CN4.5 model (Zeng et al.,
2019), and DLEM (Yang et al., 2014), and it has been partly
used in GLASS-CTEM (Melton and Arora, 2016). The fol-
lowing briefly describes the fire schemes adapted from Li et
al. (2012, 2013), Li and Lawrence (2017), and our own mod-
ifications.
The fire model is comprised of three parts: fire occurrence,
fire spread, and fire impact. The basic equation is that the
burned area in a grid cell (A
b
, km
2
s
1
) is determined by the
number of fires per time step (N
f
, count s
1
) and the average
spread area per fire (a, km
2
count
1
):
A
b
= N
f
a. (1)
2.2.1 Fire occurrence
N
f
is the product of the number of potential ignition counts
due to both natural causes (I
n
, count s
1
km
2
) and human
ignitions (I
a
, count s
1
km
2
), fuel availability (f
b
), fuel
combustibility (f
m
), and human suppression factors (f
eo
). In
this paper, we only consider non-crop fire by excluding the
cropland fraction (f
crop
) from burning:
N
f
= (I
n
+ I
a
)f
b
f
m
f
eo
(1 f
crop
)A
g
, (2)
where A
g
is the land area of the grid cell (km
2
). Fires in the
croplands are excluded here due to their small extent within
the major fire regions and their relatively low intensity (Bisti-
nas et al., 2014). Cropland fire is still a major uncertainty in
remote sensing datasets (Randerson et al., 2012), and more
data and investigation are needed.
The number of natural ignitions is related to lightning
flashes (I
l
, count s
1
); cloud-to-ground lightning fraction,
1
5.16+2.16 cos[3,min(60,λ)]
, which depends on latitude λ (Pren-
tice and Mackerras, 1977); and ignition efficiency (ψ =
0.22). The anthropogenic ignition, I
a
, is parameterized using
the number of potential anthropogenic ignitions by a person
(α = 1.35 × 10
9
count per person s
1
) and population den-
sity (D
p
; person) (Venevsky et al. 2002):
I
n
=
ψ
5.16 + 2.16cos[3,min(60,λ)]
I
l
, (3)
I
a
= αD
p
× (6.8D
0.6
p
). (4)
The fuel availability f
b
(fraction, range 01) is given as fol-
lows:
f
b
=
0 B
ag
B
low
B
ag
B
low
B
up
B
low
B
low
< B
ag
< B
up
1 B
ag
B
up
, (5)
where B
ag
(g C m
2
) is the aboveground biomass (leaf and
stem in SSiB4/TRIFFID-Fire) of all PFTs. Following Li et
al. (2012), we use B
low
= 155 g C m
2
as the lower fuel
threshold, below which fire does not occur and B
up
=
1050 g C m
2
as the upper fuel threshold, above which fuel
load is not a constraint for fire occurrence.
Fuel combustibility f
m
(fraction, 0–1) is given as follow:
f
m
= f
RH
f
θ
, (6)
where f
RH
and f
θ
represent the dependence of fuel com-
bustibility on relative humidity (RH; %) and the root zone
soil moisture (θ), respectively (Li and Lawrence, 2017). Fol-
lowing Li et al. (2013), we assume f
m
= 0 when surface air
temperature T is below 10
C. f
RH
reflects the impact of
real-time climate conditions on fuel combustibility, while f
θ
reflects the response of fuel combustibility to the preceding
climate conditions (Shinoda and Yamaguchi, 2003):
f
RH
=
0 RH RH
up
(
RH
up
RH
RH
up
RH
low
)
1.3
RH
low
< RH < RH
up
1 RH RH
low
, (7)
f
θ
=
0 θ θ
up
(
θ
up
θ
θ
up
θ
low
)
0.7
θ
low
< θ < θ
up
1 θ θ
low
. (8)
Relative humidity suppresses fire occurrence when it is larger
than RH
up
= 70 %, and relative humidity does not con-
https://doi.org/10.5194/gmd-13-6029-2020 Geosci. Model Dev., 13, 6029–6050, 2020

6032 H. Huang et al.: Modeling long-term fire impact on ecosystem characteristics
Table 1. The upper (θ
up
) and lower (θ
low
) thresholds of root zone
soil moisture for PFTs in SSiB4/TRIFFID-Fire.
Vegetation types θ
up
θ
low
BET 0.80 0.30
NET 0.80 0.30
BDT 0.80 0.30
C
3
grasses 0.75 0.30
C
4
plants 0.75 0.30
Shrubs 0.60 0.30
Tundra 0.60 0.30
strain fire when it is smaller than RH
low
= 30 %. The PFT-
dependent θ
up
and θ
low
are used as the upper and lower
thresholds of soil moisture in a similar way to the thresh-
olds of relative humidity (Table 1). In the Li et al. (2012)
fire scheme, this factor (f
θ
) is parameterized using root zone
soil moisture potential factor β (0–1.0), a model-dependent
variable used to calculate transpiration in CLM (Li and
Lawrence, 2017). β
low
= 0.85 and β
up
= 0.98 are used as
the lower and upper thresholds for all PFTs, yet the narrow
range of β in CLM5 has led to fire model too sensitive to
drought. In SSiB4/TRIFFID-Fire, the root zone soil moisture
θ is found to be the best variable to describe the dependence
of fuel combustibility on the preceding climate.
The human suppression factor (f
eo
; 0–1) reflects the de-
mographic (f
d
) and economic (f
e
) impact on fire occurrence
in populated areas (population density D
p
> 0.1 per person
km
2
):
f
seo
= f
d
f
e
. (9)
The human suppression is assumed to be negligible (f
seo
=
1) when D
p
0.1 person km
2
. A detailed description of
f
d
and f
e
parameterization can be found in Li et al. (2012,
2013).
2.2.2 Average spread area after fire ignition
The average spread area of a fire is assumed to be elliptical
in shape, with the ignition point located at one of the foci
and the fastest spread occurring along the major axis. The
average burned area of a fire a (km
2
per count) is represented
as follows (Li et al., 2012):
a = π L
B
(u
max
g
0
F
m
τ/1000)
2
F
se
, (10)
where L
B
is the length-to-breadth ratio of the ellipse shape
and is related to the wind speed, W (m s
1
):
L
B
= 1.0 + 10.0
1 exp
(
0.06W
)
. (11)
u
max
is the PFT-dependent maximum fire spread rate (m s
1
;
Table S1). g
0
= 0.05 is the dependence of fire spread rate
perpendicular to the wind direction. F
m
is the influence of
fuel wetness on fire spread and is assumed to be related to
f
m
in the fire occurrence Eq. (6):
F
m
= f
0.5
m
. (12)
τ (= 3600 × 24 s) is the global average fire duration, which
is simply taken to be 1 d, as reported by Giglio et al. (2006).
The human suppression factor, F
se
, reflects the human impact
on fire spread through firefighting activities and is parameter-
ized following Li et al. (2013).
2.2.3 Carbon emissions, post-fire mortality, and
emissions of aerosols and trace gases
In post-fire regions, the fire carbon emission, ϕ
j
(g C s
1
),
from the jth PFT is calculated based on the burned area (A
b
;
km
2
s
1
), Carbon density C
j
, and carbon combustion com-
pleteness CC
j
:
ϕ
j
= A
b
C
j
· CC
j
. (13)
C
j
= (C
leaf
, C
stem
, C
root
, C
litter
)
j
is carbon density vector
(g C km
2
) for leaf, stem, root, and litter of the j th PFT
calculated in TRIFFID. As the carbon cycle in current
SSiB4/TRIFFID does not explicitly represent the litter car-
bon storage and decomposition, we assume the litter carbon
and woody debris account for about 25 % of aboveground
biomass for global forest and about 30 % for savanna and
grassland based on previous studies (Pan et al., 2011; de
Oliveira et al., 2019). CC
j
is the corresponding combustion
completeness for leaf, stem, root, and litter of the jth PFT
(Table S2). Meanwhile, fire-induced mortality transfers car-
bon from uncombusted leaf, stem, and root to litter:
ψ
j
= A
b
C
j
· (1 CC
j
) · M
j
, (14)
where M
j
= (M
leaf
, M
stem
, M
root
)
j
is the corresponding
mortality factor for the jth PFT(Table S2).
Finally, the emissions of trace gases and aerosols species
x for the j th PFT (EM
x,j
, g s
1
) can be calculated from car-
bon emissions (ϕ
j
) using the PFT-dependent emission factor
(EF
x,j
, g species (kg dm)
1
):
EM
x,j
= EF
x,j
ϕ
j
[C]
, (15)
where
[
C
]
(= 0.5 g C (kg dm)
1
) is a unit conversion factor
from dry matter to carbon (Li et al., 2019). The emission
factors, EF
x,j
, of trace gases and aerosols in Table S3 are
based on Andreae (2019). The emissions of trace gases and
aerosols can be applied in the atmospheric chemistry model
to calculate the production of secondary aerosols, transport
of pollutants, and the resultant aerosol direct and indirect ef-
fects on climate.
2.2.4 Including the fire effect on the carbon pool
When the Li et al. (2012) fire model is coupled with CLM,
the vegetation distribution is prescribed using satellite-based
Geosci. Model Dev., 13, 6029–6050, 2020 https://doi.org/10.5194/gmd-13-6029-2020

H. Huang et al.: Modeling long-term fire impact on ecosystem characteristics 6033
land cover, and therefore the fire impact on vegetation cover
is not simulated. In SSiB4/TRIFFID-Fire, the fire-related
carbon loss due to combustion and post-fire mortality is
transferred to changes of PFT fraction based on carbon bal-
ance.
In TRIFFID (Cox, 2001), the fractional change of the jth
PFT (
df
j
dt
) is governed by the Lotka–Volterra equation:
df
j
dt
=
λ
j
NPP
j
f
j
Cv
j
h
1
X
j
c
ij
f
j
i
γ
j
f
j
, (16)
where f
j
is the fractional coverage of the j th PFT; λ
j
NPP
j
is
the carbon available for spreading; Cv
j
is the carbon density
(g C km
2
); c
ij
is the competition coefficient between the ith
and jth PFTs; and γ
j
(s
1
) is the constant disturbance repre-
senting the loss of PFT fraction due to fires, pests, windthrow,
and many other processes.
When the fire model is coupled to SSiB4/TRIFFID, the
loss of PFT fraction due to fires (β
j
) can be explicitly derived
from the fire-induced carbon loss:
β
j
=
j
+ ψ
j
) · f
j
Cv
j
, (17)
where ϕ
j
and ψ
j
are PFT-dependent carbon loss due to com-
bustion and post-fire mortality, respectively. The fire-caused
PFT fraction loss results in bare soil for vegetation spreading
decided by the competition strategy in TRIFFID. As such,
fire disturbance is explicitly represented and varies in space
and time, and the original γ
j
is adjusted to γ
0
j
to exclude fire
disturbance (Table 2):
df
j
dt
=
λ
j
· NPP
j
· f
j
C
j
h
1
X
j
c
ij
f
j
i
γ
0
j
+ β
i
f
j
. (18)
2.3 Implementing the fire model in SSiB4/TRIFFID
In SSiB4/TRIFFID, SSiB4 provides GPP, autotrophic res-
piration, and other physical variables such as canopy tem-
perature and soil moisture every 3 h for TRIFFID (Fig. 1).
TRIFFID accumulates the 3-hourly GPP and respiration and
provides biotic carbon, PFT fractional coverage, vegetation
height, and LAI every 10 d, which are used to update sur-
face properties (albedo, canopy height, roughness length, and
aerodynamic/canopy resistances) in SSiB4. When the fire
model is included, it uses the meteorological forcings and
physical variables provided by SSiB4 every 3 h and the bio-
physical properties (PFT fraction and biotic carbon) provided
by TRIFFID every 10 d. The fire model calculates the burned
area, carbon combustion, post-fire mortality, and emissions
every 3 h, and the fire-induced carbon loss is subtracted from
fuel load. The carbon loss is accumulated within 10 d in
the fire model and is transferred to TRIFFID on day 10.
TRIFFID updates the vegetation dynamics based on carbon
balance on day 10, using the net primary production, fire-
induced carbon loss, and PFT competition strategy. The up-
dated vegetation dynamics are transferred to SSiB4 to reflect
fire effects on surface properties.
3 Experimental setup and data
3.1 Experimental design
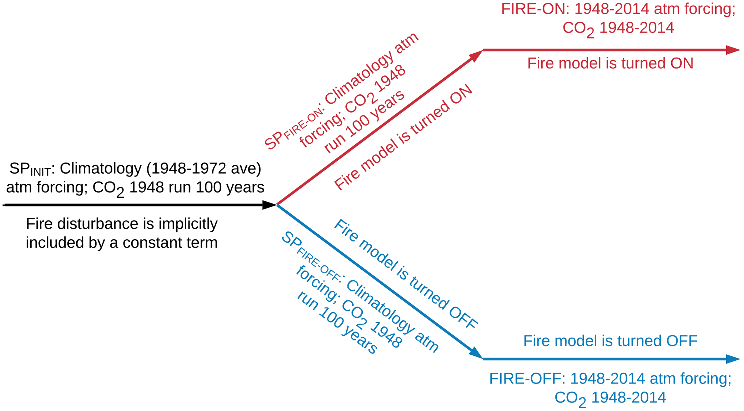
Two sets of offline experiments have been conducted
using SSiB4/TRIFFID-Fire, which consist of FIRE-ON
(SSiB4/TRIFFID-Fire with fire model switched on) and
FIRE-OFF (SSiB4/TRIFFID-Fire with fire model switched
off). To obtain the initial conditions for these two experi-
ments, similar to our previous SSiB4/TRIFFID experiments
(Zhang et al., 2015; Liu et al., 2019), we conducted spin-
up simulations (SP
FIRE-ON
and SP
FIRE-OFF
) for 100 years to
reach a quasi-equilibrium PFT distribution with and with-
out fire disturbance. These spin-up simulations were initial-
ized using the quasi-equilibrium state from Liu et al. (2019)
(SP
INIT
in Fig. 2) and were driven by climatology forcing av-
eraged over 1948–1972 and atmospheric CO
2
concentration,
population density, and GDP in 1948 (Fig. 2). Following Liu
et al. (2019), the quasi-equilibrium status is defined as the
rate of relative change in fractional coverage of all PFTs is
less than 2 % over the last 10 years of simulation.
Based on the quasi-equilibrium status with fire disturbance
(SP
FIRE-ON
), a transient run was performed (FIRE-ON) with
the fire model turned on from 1948 to 2014 (Fig. 2). The
model was forced by 3-hourly meteorological forcings and
yearly updated atmospheric CO
2
concentration, population
density, and GDP data. FIRE-ON produced the fire regime,
ecosystem, and surface conditions during 1948–2014. A
FIRE-OFF run, based on SP
FIRE-OFF
, was carried out with
the fire model switched off during 1948–2014. The vegeta-
tion distribution was allowed to respond to climate variations
in both FIRE-ON and FIRE-OFF simulations and to fire dis-
turbances only in the FIRE-ON.
3.2 Model input and validation data
The meteorological forcings used to drive SSiB4/TRIFFID-
Fire for the period of 1948–2014 are from the Prince-
ton global meteorological dataset for land surface model-
ing (Sheffield et al., 2006), including surface air tempera-
ture, surface pressure, specific humidity, wind speed, down-
ward shortwave radiation flux, downward longwave radia-
tion flux, and precipitation (Table 3). The dataset is con-
structed by combining global observation-based datasets
with the NCEP/NCAR reanalysis. The spatial resolution is
1.0
× 1.0
, and the temporal interval is 3 h.
The required inputs for driving the fire model are listed
in Table 3. The 2-hourly climatology lightning flashes data
from NASA LIS/OTD v2.2 at 2.5
× 2.5
resolution are used
to calculate the number of natural ignitions. The population
https://doi.org/10.5194/gmd-13-6029-2020 Geosci. Model Dev., 13, 6029–6050, 2020

Citations
More filters

Global patterns of land-atmosphere fluxes of carbon dioxide, latent heat, and sensible heat derived from eddy covariance, satellite, and meteorological observations

Abstract: We upscaled FLUXNET observations of carbon dioxide, water, and energy fluxes to the global scale using the machine learning technique, model tree ensembles (MTE). We trained MTE to predict site-level gross primary productivity (GPP), terrestrial ecosystem respiration (TER), net ecosystem exchange (NEE), latent energy (LE), and sensible heat (H) based on remote sensing indices, climate and meteorological data, and information on land use. We applied the trained MTEs to generate global flux fields at a 0.5 degrees x 0.5 degrees spatial resolution and a monthly temporal resolution from 1982 to 2008. Cross-validation analyses revealed good performance of MTE in predicting among-site flux variability with modeling efficiencies (MEf) between 0.64 and 0.84, except for NEE (MEf = 0.32). Performance was also good for predicting seasonal patterns (MEf between 0.84 and 0.89, except for NEE (0.64)). By comparison, predictions of monthly anomalies were not as strong (MEf between 0.29 and 0.52). Improved accounting of disturbance and lagged environmental effects, along with improved characterization of errors in the training data set, would contribute most to further reducing uncertainties. Our global estimates of LE (158 +/- 7 J x 10(18) yr(-1)), H (164 +/- 15 J x 10(18) yr(-1)), and GPP (119 +/- 6 Pg C yr(-1)) were similar to independent estimates. Our global TER estimate (96 +/- 6 Pg C yr(-1)) was likely underestimated by 5-10%. Hot spot regions of interannual variability in carbon fluxes occurred in semiarid to semihumid regions and were controlled by moisture supply. Overall, GPP was more important to interannual variability in NEE than TER. Our empirically derived fluxes may be used for calibration and evaluation of land surface process models and for exploratory and diagnostic assessments of the biosphere.
Journal ArticleDOI

Estimating global aerodynamic parameters in 1982–2017 using remote-sensing data and a turbulent transfer model

TL;DR: In this paper, the authors provide global estimates of these bulk aerodynamic parameters, including d, z0, rb, and rd, for the period 1982-2017 based on remote-sensed leaf area index (LAI), h, and plant functional type dependent canopy morphological characteristics.

Impact of burned areas on the northern African seasonal climate from the perspective of regional modeling

TL;DR: In this article, the authors investigated the impact of burned areas on the surface energy balance and monthly precipitation in northern Africa as simulated by a state-of-the-art regional model and found that post-fire land condition deterioration resulted in a decrease in precipitation over sub-Saharan Africa, associated with the weakening of the West African monsoon progression through the region.
Journal ArticleDOI

BASNet: Burned Area Segmentation Network for Real-Time Detection of Damage Maps in Remote Sensing Images

TL;DR: The proposed BASNet significantly outperforms the state-of-the-art SOD methods quantitatively and qualitatively and achieves a promising prediction speed for processing high-resolution UAV images, thus providing wide-ranging applicability in post-disaster monitoring and management.
References
More filters
Journal ArticleDOI

The global distribution of ecosystems in a world without fire

TL;DR: Comparison of global 'fire off' simulations with landcover and treecover maps show that vast areas of humid C(4) grasslands and savannas, especially in South America and Africa, have the climate potential to form forests.
Journal ArticleDOI

Development of a 50-Year High-Resolution Global Dataset of Meteorological Forcings for Land Surface Modeling

TL;DR: In this article, the authors describe the creation of a global, 50-yr, 3-hourly, 1.0° dataset of meteorological forcings that can be used to drive models of land surface hydrology.
Journal ArticleDOI

Interannual variability in global biomass burning emissions from 1997 to 2004

TL;DR: In this paper, the authors investigated fire emissions during the 8 year period from 1997 to 2004 using satellite data and the CASA biogeochemical model, and found that on average approximately 58 Pg C year −1 was fixed by plants as NPP, and approximately 95% of this was returned back to the atmosphere via R h.
Journal ArticleDOI

GLC2000: a new approach to global land cover mapping from Earth observation data

TL;DR: A new global land cover database for the year 2000 (GLC2000) has been produced by an international partnership of 30 research groups coordinated by the European Commission's Joint Research Centre as discussed by the authors.
Related Papers (5)
Frequently Asked Questions (17)
Q1. What have the authors contributed in "Modeling long-term fire impact on ecosystem characteristics and surface energy using a process-based vegetation–fire model ssib4/triffid-fire v1.0" ?

This study incorporates a fire model of intermediate complexity to a biophysical model with dynamic vegetation, SSiB4/TRIFFID ( The Simplified Simple Biosphere Model coupled with the Topdown Representation of Interactive Foliage and Flora Including Dynamics Model ). 

It reasonably reproduces the global GPP and PFT distribution, which is important to study fire effects on the ecosystem. The SSiB4/TRIFFID-Fire is then applied to study the long-term fire effects on ecosystem characteristics and surface energy. HH conducted the simulation with suggestions from FL and YL. 

Other sources of uncertainties include the differences in the partitioning between latent heat and sensible heat fluxes in land surface models, the differences in the parameterization of the evaporation processes, and the changes due to atmospheric feedbacks, such as cloud cover and precipitation changes. 

Over the African and South American savanna, the authors find fire has reduced the area-averaged LAI and vegetation height by 0.52 m2 m−2 (12.5 %) and 5.76 m (49.1 %), respectively. 

Some fire models have been used to assess long-term fire impact on the terrestrial carbon cycle by comparing a reference simulation with fire and a sensitivity simulation representing “a world without fire”. 

In TRIFFID (Cox, 2001), the fractional change of the j th PFT ( dfjdt ) is governed by the Lotka–Volterra equation:dfj dt = λjNPPj fj Cvj[ 1− ∑ j cijfj ] − γjfj , (16)where fj is the fractional coverage of the j th PFT; λjNPPj is the carbon available for spreading; 

The inaccurate simulation of fire season in several fire regions could come from deficiency of the forcing data, the inaccuracy in dynamic vegetation processes, or some processes that control the fire but are not represented in the model. 

When the fire model is coupled to SSiB4/TRIFFID, the loss of PFT fraction due to fires (βj ) can be explicitly derived from the fire-induced carbon loss:βj = (ϕj +ψj ) · fjCvj , (17)where ϕj and ψj are PFT-dependent carbon loss due to combustion and post-fire mortality, respectively. 

The average spread area of a fire is assumed to be elliptical in shape, with the ignition point located at one of the foci and the fastest spread occurring along the major axis. 

In the Li et al. (2012) fire scheme, this factor (fθ ) is parameterized using root zone soil moisture potential factor β (0–1.0), a model-dependent variable used to calculate transpiration in CLM (Li and Lawrence, 2017). 

Cvj is the carbon density (g C km−2); cij is the competition coefficient between the ith and j th PFTs; and γj (s−1) is the constant disturbance representing the loss of PFT fraction due to fires, pests, windthrow, and many other processes. 

(13)Cj = (Cleaf,Cstem,Croot,Clitter)j is carbon density vector (g C km−2) for leaf, stem, root, and litter of the j th PFT calculated in TRIFFID. 

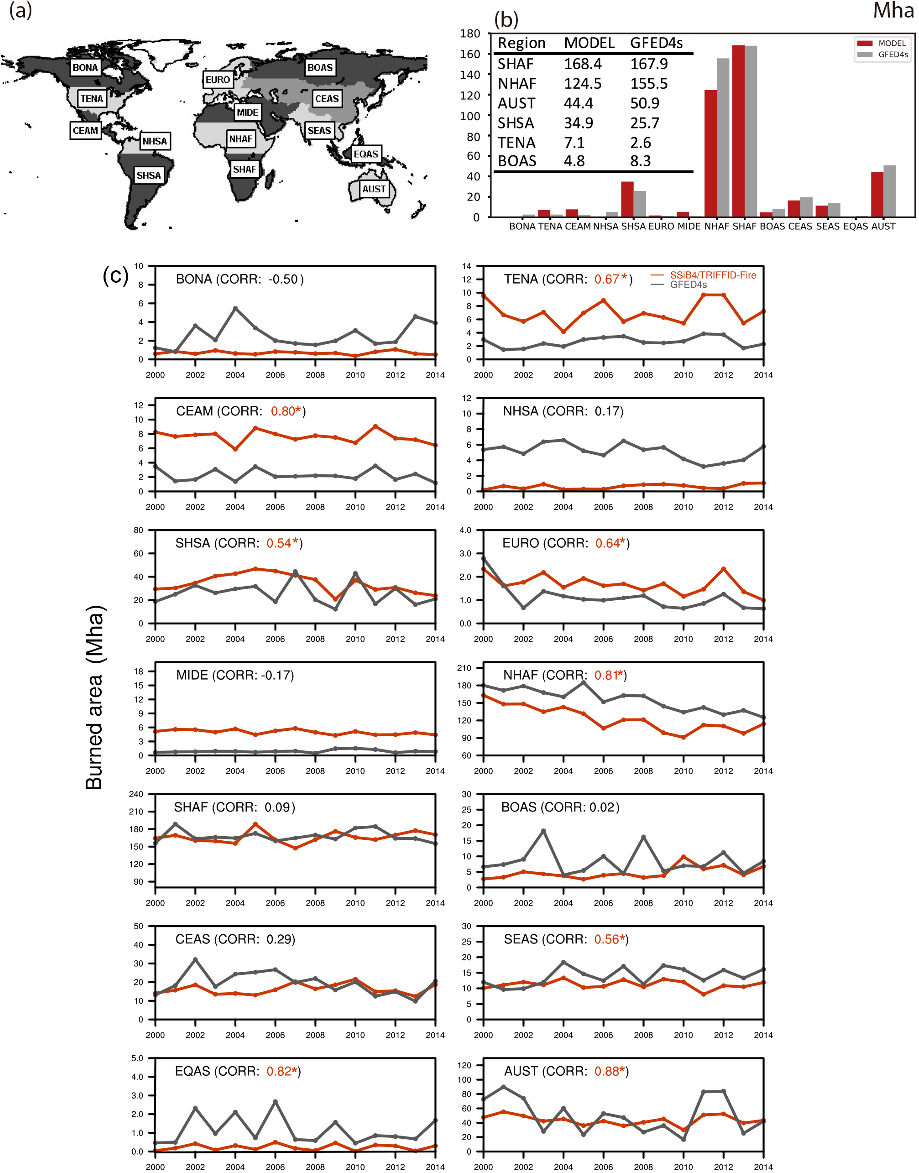
The burned area in African savanna accounts for more than 60 % of the global burned area in both GFED4s and SSiB4/TRIFFID-Fire (Fig. 4b). 

Fire models have been used to reconstruct fire history before the satellite era (Yang et al., 2015; van Marle et al., 2017; Li et al., 2019). 

In SSiB4/TRIFFID-Fire, the root zone soil moisture θ is found to be the best variable to describe the dependence of fuel combustibility on the preceding climate. 

Their results are consistent with the long-term fire experiments that reported that fire strongly affected vegetation structure, lowering the proportions of trees to fire-resistant grasses and reducing the vegetation height and aboveground biomass (Shackleton and Scholes, 2000; Higgins et al., 2007; van Wilgen et al., 2007; Furley et al., 2008; Smit et al., 2010; Devine et al., 2015), and that fire impact is more significant in wetter savanna than in drier savanna (Moreira, 2000; Sankaran et al., 2005). 

In general, the spatial distribution of carbon emissions coincides with that of the burned area: SHAF, NHAF, and SHSA are the major fire emission regions and they contribute to 65.4 % of the total emission in both GFED4s and SSiB4/TRIFFID-Fire (Fig. 8a).