
All figures (13)
![Fig. 4. Histograms of the pixel values for the 304 Å channel. In blue we show the histogram for the refence image, and in red the histogram for the dimmed image. The y-axis is the number of pixels, and the x-axis is the pixel intensity [DN/px/s]. The modes are marked with blue and red lines for the reference and dimmed images, respectively.](/figures/fig-4-histograms-of-the-pixel-values-for-the-304-a-channel-3qberx6l.png) Fig. 4. Histograms of the pixel values for the 304 Å channel. In blue we show the histogram for the refence image, and in red the histogram for the dimmed image. The y-axis is the number of pixels, and the x-axis is the pixel intensity [DN/px/s]. The modes are marked with blue and red lines for the reference and dimmed images, respectively.
Fig. 4. Histograms of the pixel values for the 304 Å channel. In blue we show the histogram for the refence image, and in red the histogram for the dimmed image. The y-axis is the number of pixels, and the x-axis is the pixel intensity [DN/px/s]. The modes are marked with blue and red lines for the reference and dimmed images, respectively. Fig. 1. Set of images to exemplify how degradation affects the AIA channels. The two sets are composed of seven images from different EUV channels. From left to right: AIA 94 Å, AIA 131 Å, AIA 171 Å, AIA 193 Å, AIA 211 Å, AIA 304 Å, and AIA 335 Å. Top row: images from 13 May 2010, and bottom row: images from 31 August 2019, without correction for degradation. The 304 Å channel images are in log-scale because the degradation is severe.
 Table 2. Results of the baseline and CNN models applied to all the EUV AIA channels.
 Table 3. Goodness-of-fit metrics for single- and multichannel models with reference to the V9 degradation curve.
 Fig. 7. Feature maps obtained from the last layer of the CNN of our model. Top row: a sample input in the AIA 193 Å channel, and bottom row: 4 representative feature maps out of 128 different feature maps from the final convolutional layer of the multichannel CNN model.
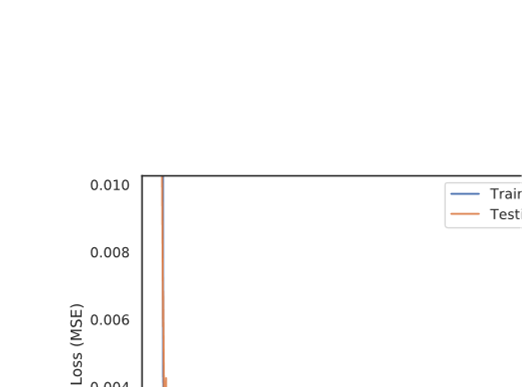 Fig. 5. Graphic of the evolution of training and testing MSE loss through the epochs.
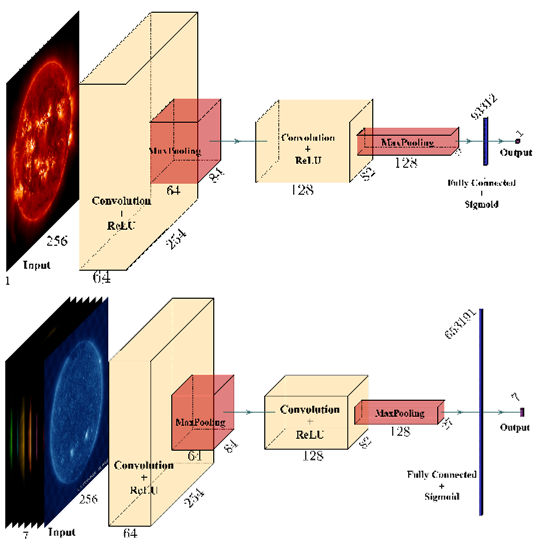 Fig. 3. CNN architectures. The single-channel architecture with a single wavelength input that is composed of two blocks of a convolutional layer is shown at the top, with the ReLU activation function and max pooling layer, followed by a fully connected (FC) layer and a final sigmoid activation function. The multichannel architecture with a multiwavelength input that is composed of two blocks of a convolutional layer is shown at the bottom, with the ReLU activation function and max pooling layer, followed by an FC layer and a final sigmoid activation function. Figures constructed following Iqbal (2018).
 Fig. 2. Colocated set of images of the seven EUV channels of AIA to exemplify structures that are observed at different wavelengths. From left to right: AIA 94 Å, AIA 131 Å, AIA 171 Å, AIA 193 Å, AIA 211 Å, AIA 304 Å, and AIA 335 Å.
 Table B.1. Detailed single-channel architecture.
 Table B.2. Detailed multichannel architecture.
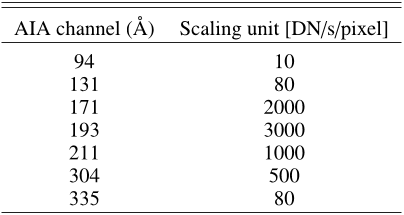 Table A.1. AIA channel scaling units.
 Fig. 6. Channel degradation over time. From top to bottom: Channel 94 Å (blue), 131 Å (yellow), 171Å (green), 193 Å (red), 211 Å (purple), 304 Å (brown), and 335 Å (magenta). The solid black (gray) curve is the degradation profile of AIA calibration release V9 (V8). The gray shaded area correspond to the error (10% earlier than May 2014 and 28% error later) of the degradation curve V9. The colored shaded areas are the standard deviation of the CNN models. The vertical dashed black line is the last available observation from EVE MEGS-A data, and the vertical dashed gray line is the last training date.
 Table 1. MSE for all combinations proposed in Sect. 3.4.
Luiz F. G. dos Santos1, Luiz F. G. dos Santos2, Souvik Bose3, Valentina Salvatelli4, Brad Neuberg4, Mark C. M. Cheung, Miho Janvier5, Meng Jin4, Yarin Gal6, Paul Boerner, Atılım Güneş Baydin6 • 


