
All figures (10)
 Figure 1: Pump (200 Hz) and probe (2000 Hz) signals in terms of multiples of the optical wavelength, their cross-modulation and its frequency spectrum
 Figure 4: A vibrating plate (L · W) with a defect at (0.6L, 0.6W) and a radius of 0.16L excited at multiple frequencies when sampled at (A) 1, (B) 7, (C) 8 and (D) 6 kHz at a random instant
![Figure 5: The respective intensity fringe patterns of Figure 4 normalised in the greyscale range [0, 1] (Equation 18)](/figures/figure-5-the-respective-intensity-fringe-patterns-of-figure-3u0lpltj.png) Figure 5: The respective intensity fringe patterns of Figure 4 normalised in the greyscale range [0, 1] (Equation 18)
Figure 5: The respective intensity fringe patterns of Figure 4 normalised in the greyscale range [0, 1] (Equation 18) Figure 10: Fringe patterns of the sandwich plate obtained while it is excited simultaneously by a shaker and the piezoelectric transducer at 5 and at 50 kHz respectively. (A) Image obtained with only 5 kHz excitation; (B) image obtained with only 50 kHz excitation; (C) image obtained with both excitations active and shearography triggered at their difference 45 kHz; and (D) image obtained with both excitations active and shearography triggered at 5 kHz. The dimensions of the images are 12 cm (H) · 16 cm (W)
![Figure 6: The plate of Figure 4 when normalised in the greyscale range [0, 1] (Equation 18) and sampled at (A) 1, (B) 7, (C) 8 and (D) 6 kHz and a phase difference of 90](/figures/figure-6-the-plate-of-figure-4-when-normalised-in-the-yc90y6cs.png) Figure 6: The plate of Figure 4 when normalised in the greyscale range [0, 1] (Equation 18) and sampled at (A) 1, (B) 7, (C) 8 and (D) 6 kHz and a phase difference of 90
Figure 6: The plate of Figure 4 when normalised in the greyscale range [0, 1] (Equation 18) and sampled at (A) 1, (B) 7, (C) 8 and (D) 6 kHz and a phase difference of 90 Figure 7: Specimens with embedded defects – dimensions are given in millimetre
 Figure 2: Sampling function (stroboscopic illumination triggered at the fundamental frequency 200 Hz), normalised intensity variation (Equation (18)) and recorded signal over one period (20 ms for a CCD with frequency of 50 Hz) for a single pixel taking into account 3% of noise
 Figure 8: Experimental setup
 Figure 9: Fringe patterns of the sandwich plate obtained with shearography (zoomed around the lower left part). Excitation is carried out with a piezoelectric transducer at (A) 10, (B) 20 and (C) 50 kHz. The dimensions of the images are 6 cm (H) · 8 cm (W)
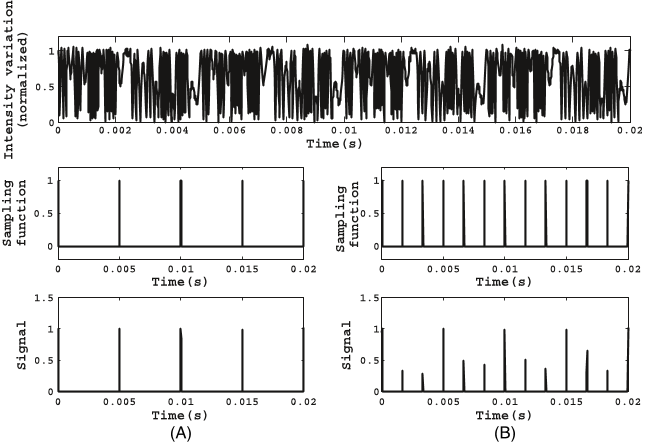 Figure 3: Normalised intensity variation for the cross-modulation signal (200 and 800 Hz) and the recorded signal over one period (20 ms for a CCD with frequency of 50 Hz) for different sampling frequencies: (A) triggered at the ‘pump’ frequency 200 Hz and (B) triggered at the mixed frequency 600 (800 ) 200) Hz


![Figure 5: The respective intensity fringe patterns of Figure 4 normalised in the greyscale range [0, 1] (Equation 18)](/figures/figure-5-the-respective-intensity-fringe-patterns-of-figure-3u0lpltj.webp)

![Figure 6: The plate of Figure 4 when normalised in the greyscale range [0, 1] (Equation 18) and sampled at (A) 1, (B) 7, (C) 8 and (D) 6 kHz and a phase difference of 90](/figures/figure-6-the-plate-of-figure-4-when-normalised-in-the-yc90y6cs.webp)


