
All figures (10)
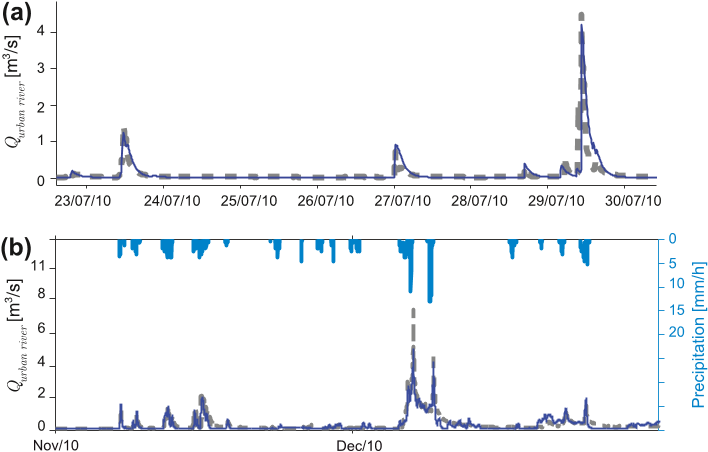 Fig. 6. Sample hydrograph for the calibration period (a) and full validation period (b) for flow modeled at river outlet. Gray dashes are field measurements, solid lines are model predictions and precipitation rate is on the right abscissa of (b).
 Fig. 7. Results of the sensitivity analysis. The model is sensitive to ksub; ksup and c to a lesser extent. The NS criterion is in black and NB in gray. All model parameters are scaled between 0 and 100.
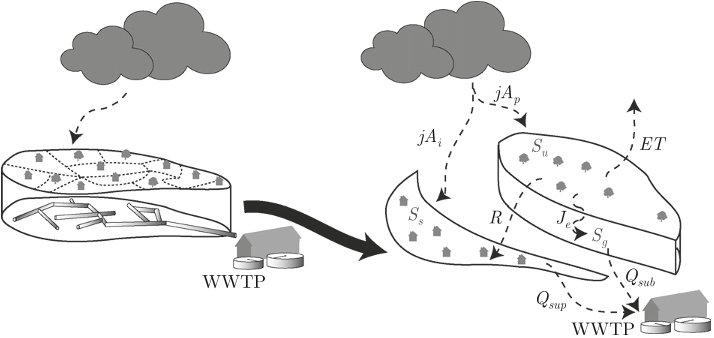 Fig. 1. Schema of the WWTP catchment conceptualization. The pipe and channel netw reservoir. The other part of the rain jAp enters the pervious zone (Su), where it can ev framework applies for river basin modeling. In the case where the model is used to sim network, thereby modeling the drainage effect of the sewer system, which is in addition WWTP is replaced by the river. Symbols are explained in the text.
 Fig. 8. Dominant pathways considered. Endpoints of the system are the river and the WWTP.
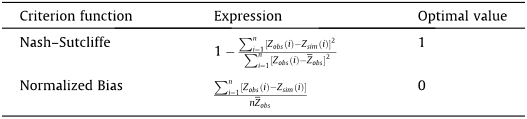 Table 1 Mathematical expressions of adopted fitting criteria functions e.g.,(Nash and Sutcliffe, 1970; Hingray et al., 2009; Schaefli and Gupta, 2007; Fenicia et al., 2007; Reusser et al., 2008). Zsim and Zobs are the modeled and observed values and n is the number of observations.
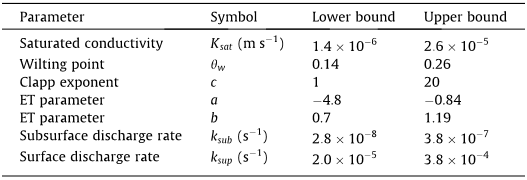 Table 2 Calibration parameters and the range of values considered. For the Monte-Carlo parameter optimization procedure, a uniform distribution was considered.
 Fig. 2. Linear low partitioning function applied to the representative CSO. The maximum flow reaching the WWTP is limited by the threshold, Qlim . The excess is diverted out of the modeled pipe network.
 Fig. 3. Two basins are studied. For the Vidy Bay WWTP (white), the catchment is fully artificial, and is composed of Lausanne’s pipe network. The other is the urban basin of the Vuachère river (gray). The two basins partly overlap.
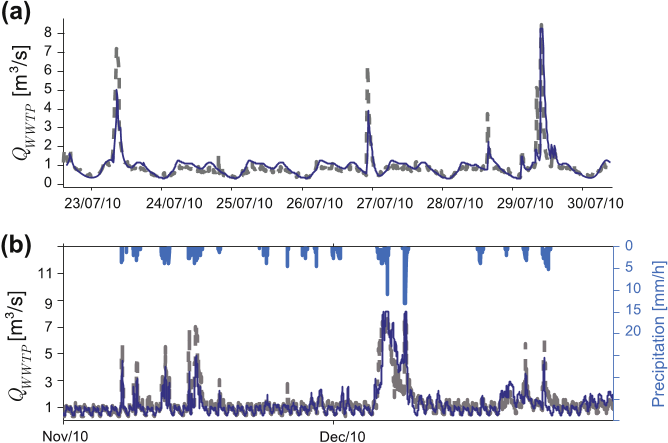 Fig. 4. Sample of the hydrograph for the calibration period (a) and full validation period (b) for flow modeled at WWTP inlet. Gray dashes are field measurements, solid lines are model predictions and precipitation rate is on the right abscissa of (b).
 Fig. 5. Comparison of flow modeled at the WWTP with the presented model (black) and the RS-3.0 model (gray).


