scispace - formally typeset
Search or ask a question
Journal ArticleDOI

Parsimonious hydrological modeling of urban sewer and river catchments

TL;DR: In this paper, a parsimonious model of flow capable of simulating flow in natural/engineered catchments and at WWTP (Wastewater Treatment Plant) inlets was developed.
About: This article is published in Journal of Hydrology.The article was published on 2012-09-25 and is currently open access. It has received 36 citations till now. The article focuses on the topics: Impervious surface & Combined sewer.

Summary (4 min read)

1. Introduction

  • Catchment modeling is a mature discipline, and much research and modeling has been carried out on natural catchments.
  • Such models are valuable for many purposes, of course.
  • Aquatic Science and Technolerland. , Swiss Federal Institute of m/, last accessed December and Woolhiser (2002) for a review).
  • The model integrates the main physical processes in urban catchments (i.e., precipitation, infiltration, soil moisture, runoff, streamflow and groundwater flow), but without consideration of the detailed pipe drainage network.
  • In urban systems, these two endpoints drain overlapping basins.

2. Design and mathematical description of the model

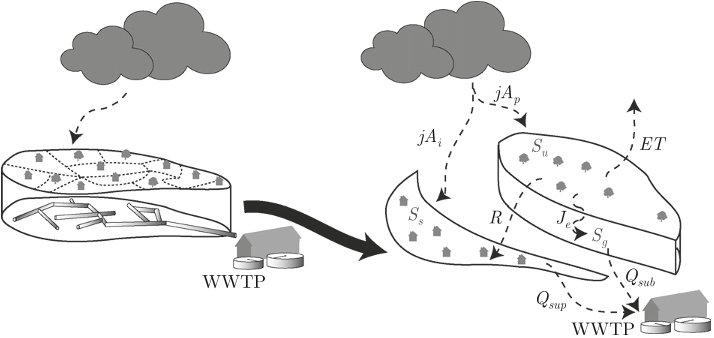
  • The basin is modeled as a set of three storages (one surface and two subsurface), each characterized by a state variable representing the water stored within it (Fig. 1).
  • The two meteorological forcings considered are precipitation and air temperature, T, both assumed uniform over the basin.
  • The subterranean layer is represented as composed of two reservoirs: the upper soil (or root zone) region and the groundwater region with, respectively, storages of Su and Sg (Botter et al., 2010).

2.1. Modeling of surface processes

  • This water bypasses the subsurface flow, and is treated as a separate component in the lumped model.
  • When falling on the pervious fraction of the basin, the rain can either infiltrate or produce overland flow.
  • This storage also receives the precipitation flux falling on any impervious surfaces, jAi.
  • The output, Q sup, from this storage produces the fast component of the total streamflow.

2.2. Modeling of subsurface processes

  • Surface infiltration enters the root zone storage, the total volume of which is: Su ¼ ZhAp; ð3Þ with Z [L] the depth of the active soil layer.
  • Two types of outputs from this region are considered: evapotranspiration, ET, and deep percolation, Je.

ET ¼ ApETmaxf ðhÞ; ð4Þ

  • A fraction jAi of the rainfall enters this apotranspires or percolates to the subsurface linear reservoir (Sg ).
  • Note that same ulate flow at the WWTP entrance, the subsurface reservoir discharges into the pipe to artificial inputs from water use (see Section 2.4).
  • The maximum evapotranspiration is computed through a modified version of the Blaney–Criddle equation (e.g., Doorenbos and Pruitt, 1975): ETmax ¼ aþ b½pð0:46Tþ 8:13Þ ; ð6Þ where a and b are fitting parameters and p is the mean annual percentage of daytime hours, which varies only with latitude (Allen et al., 1998).
  • This formulation of subterranean flow, based on Botter et al. (2010), is easily extendible to account for interflow (or subsurface runoff) through shallow soil layers.

2.3. Consideration of CSOs

  • A characteristic feature of hybrid sewer networks are CSOs.
  • In the drainage network, CSOs divert flows above a certain level directly to receiving waters, rather than to the WWTP (Butler and Davies, 2010; Lee and Bang, 2000; Wisner et al., 1981).
  • The authors consider in this study that a single, representative flow delimiter is sufficient to model the effect of all CSOs of the system in a lumped fashion manner.
  • This representative CSO is modeled using a diversion law that follows a linear threshold-limited function (in Fig. 2).

2.4. Dynamics of wastewater production

  • During dry weather, discharges arriving at the WWTP inlet are determined mainly by two phenomena: (i) infiltration of groundwater into the pipe network (see Section 2.2 and Dupont et al. (2006); Göbel et al. (2004)) and, (ii) water use and consequent wastewater production.
  • This ‘artificial’ water input, which is not present in a natural catchment, is modeled based on statistical analysis presented by Jordan (2010).
  • Monthly, daily and hourly flow coefficients are extrapolated from temporal series analysis and considered as characteristic of the system.
  • This includes direct water consumption in households, and all parasitic clear water (fountains, street washing, industrial uses, etc).

3. Optimization of hydrological quality index

  • Model calibration was performed based on the two objective functions in Table 1, since this combination has been found to yield better overall fits (Hingray et al., 2009; Perrin et al., 2001).
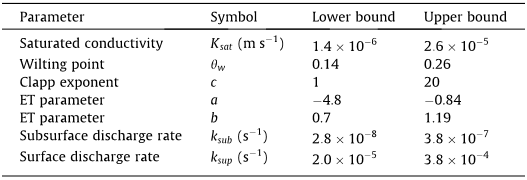
  • The list of fitting criteria and the range of prior values given before calibration process can be found in Table 2.
  • Similarly to Fenicia et al. (2006) and Seibert (2000), the calibration approach adopted here is based on a Monte Carlo algorithm designed to optimize the model performance, using the Nash–Sutcliffe (NS) and the Normalized Bias (NB) criteria (Table 1).
  • The former places an emphasis on the model’s ability to estimate large magnitudes (i.e., peak discharge), while the latter weights more the deviation between simulated and observed water balance, as follows: Minfð1 NSÞþ j NB jg: ð10Þ 4 http://www.meteosuisse.ch, last accessed January 2012.

4.1. Application of the model to an urban basin: Modeling of flow at the river outlet and WWTP entrance

  • The same modeling framework is employed to model both the dynamics of flows at an urban river outlet and inlet of a local WWTP.
  • The application area is the city of Lausanne in Switzerland, which has a population of about 200,000 and is characterized by a steep average gradient towards nearby Lake Geneva.
  • A feature of Lausanne is that the WWTP catchment and the river catchment overlap over a fraction of the city (Fig. 3).
  • The model is calibrated twice on the same time period, once to model the WWTP input, and once to model the river output to the adjacent Lake Geneva, which is the receiving water body for both river and WWTP discharges.

4.2. Application to the WWTP basin

  • The WWTP catchment under study is the Lausanne hybrid (partially-separate) sewer system, drains to the Vidy Bay WWTP.
  • A large part of the water is in consequence diverted through drainage out of the WWTP basin.
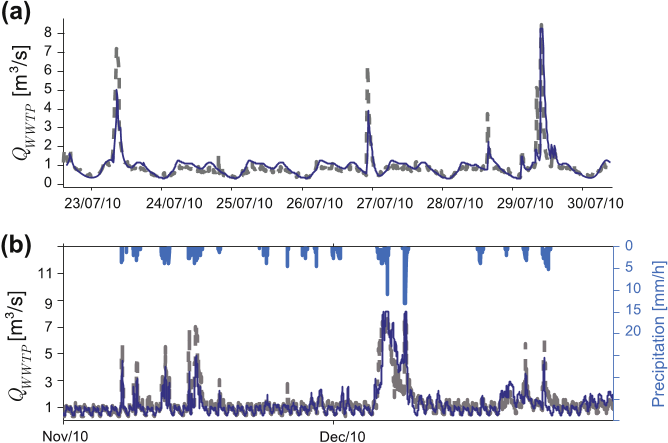
  • The flow rate at the WWTP entrance during significant storm events is attenuated by the presence of CSOs; this behavior is captured by the simulator.
  • The modeling results in Fig. 4 do not capture perfectly the measured data.

4.3. Application to the river basin

  • The modeled river, called the Vuachère, is located in the eastern part of the city of Lausanne (Fig. 3).
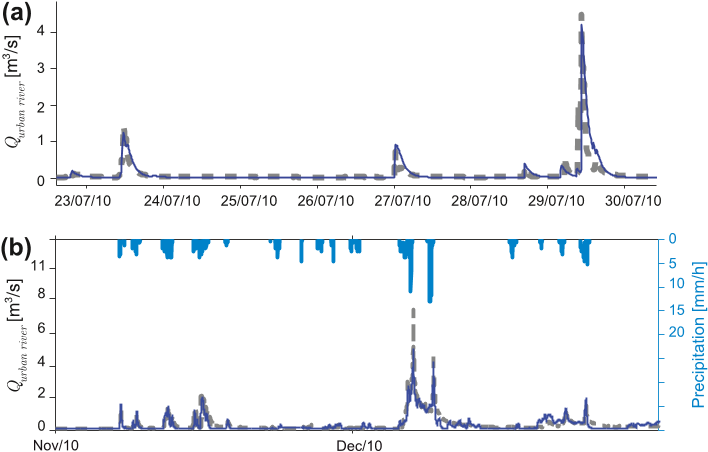
  • The flow rate was measured at the outlet of the river basin, just before discharge into Lake Geneva.
  • The calibration and validation periods were taken the same as for the WWTP basin modeling.
  • Different factors in the model drive the simulated flow dynamics in the river.

5. Sensitivity analysis

  • A sensitivity analysis was conducted to estimate the influence of the model parameters (Table 2).
  • Each parameter was varied within the prior range of acceptable values for this parameter, and the two fitting criteria (Nash–Sutcliff and Normal Bias) computed.
  • The authors see from Fig. 7 that two parameters mainly govern the overall performance of the model.
  • These are the discharge constants of the surface impervious reservoir (ksup) and the subsurface reservoir (ksub).
  • On the other hand, changes in the ksub value degrade the ability of the model to reproduce the base flow, and thus move the Normal Bias criterion away from its optimal value of 0, in addition to affecting the Nash–Sutcliff criterion.

6. Discussion

  • The lumped modeling approach was designed to predict, with an identical framework, both flow at the WWTP inlet and at the outlet of the river basin overlapping the WWTP catchment.
  • Saturation excess could be easily implemented but at cost of additional calibration parameter.
  • Another key assumption is the way CSOs are represented.
  • For the river, CSOs provide additional water as excess water in the pipe network is diverted to prevent overloading the WWTP.
  • In agreement with Leon et al. (2010), the study presented here presents a physically consistent model that, despite its simplifications, allows prediction of water flow dynamics in two structurally different basins.

7. Conclusion

  • A hierarchical physically based storage and transmission model was designed as an alternative means for simulating continuous flow dynamics in complex engineered urban basins.
  • The model ignores the complexity of the drainage network, while reproducing efficiently the flow dynamics at the different end-points.
  • Two important modeling assumptions are: (i) the pipe network is replaced by an underground impervious area and thus overland flow and pipe discharge can be together modeled as a fast discharge linear reservoir, and (ii) the water diverted out of the sewer system through the different CSOs can be combined together through the hydraulic discharge function of a representative CSO.
  • Therefore, their approach is ideal for repetitive tasks such as model calibration and optimization.
  • In addition, the model can serve as the flow part of more complex models assessing complex diffuse pollution production and transfer processes.

Did you find this useful? Give us your feedback

Figures (10)
Citations
More filters
Journal ArticleDOI
TL;DR: It is found that least squares performs similarly to more sophisticated approaches such as a Bayesian autoregressive error model in terms of both accuracy and reliability if calibration periods are long or if the input data and the model have minimal bias.
Abstract: Sophisticated methods for uncertainty quantification have been proposed for overcoming the pitfalls of simple statistical inference in hydrology. The implementation of such methods is conceptually and computationally challenging, however, especially for large-scale models. Here, we explore whether there are circumstances in which simple approaches, such as least squares, produce comparably accurate and reliable predictions. We do so using three case studies, with two involving a small sewer catchment with limited calibration data, and one an agricultural river basin with rich calibration data. We also review additional published case studies. We find that least squares performs similarly to more sophisticated approaches such as a Bayesian autoregressive error model in terms of both accuracy and reliability if calibration periods are long or if the input data and the model have minimal bias. Overall, we find that, when mindfully applied, simple statistical methods such as least squares can still be useful for uncertainty quantification.

10 citations

01 Jan 2013
TL;DR: In this article, the authors propose an approach for identifying and quantifying the sources diffused de micropolluants dans le lac Leman by using a methodologie de screening.
Abstract: Les sources diffuses de contamination dans le Lac Leman font regulierement l’objet de suivi par l’entremise de la CIPEL et de travaux de recherche, notamment le projet LEMAN21 (www.leman21.ch). Plusieurs questions restent neanmoins ouvertes, en ce qui concerne l’origine de cette contamination, son importance et la maniere de l’apprehender. Dans le cadre d’un mandat de l’Office federal de l’environnement, ce travail a pour buts : 1. Identifier et quantifier les sources diffuses de micropolluants dans le lac Leman par le biais de prelevements et d’analyse sur 3 affluents du Leman; 2. Developper une approche methodologique pour l’echantillonnage de sources diffuses de micropolluants; 3. Proposer une approche conceptuelle pour l’ensemble des apports diffus dans le lac Leman. Trois bassins versants ont ete equipes de systemes de mesure des debits et d’echantillonneurs afin de mesurer les concentrations de 19 substances lors d’evenements pluvieux et par temps sec : Rhone (Porte-du-Scex), Chamberonne et Venoge. Sur le Rhone, 3 campagnes d’echantillonnage sur 14 jours (echantillons composites journaliers) ont ete menees. Les echantillons moyens ont ete egalement analyses en suivant la methodologie de Screening developpee par l’Eawag sur le Rhin. Les resultats montrent des concentrations relativement faibles pour le Rhone, avec la presence de quelques substances a caractere industriel. Les gammes de concentrations sont similaires a celles mesurees sur le Rhin. La methodologie de Screening a permis d’identifier une molecule non communement mesuree sur le Rhone. Les concentrations sur les rivieres Chamberonne et Venoge, des cours d’eau representatifs des affluents du Leman en termes de concentrations en pesticides, montrent des concentrations relativement faibles par temps sec et une dynamique importante par temps de pluie conduisant a des concentrations depassant parfois les normes de qualite environnementales (NQE). Pour chaque bassin versant, les quantites de substances utilisees en agriculture ont ete estimees sur la base de l’outil PESTIBASE developpe par la CIPEL. Pour le bassin du Rhone, la comparaison entre les quantites theoriques appliquees et les concentrations mesurees dans le Rhone est satisfaisante. Une enquete detaillee sur une partie du bassin versant de la Chamberonne a egalement ete effectuee. L’etude de la representativite des resultats a ete effectuee en utilisant des outils bases sur la theorie de l’echantillonnage. Pour le Rhone, des incertitudes de l’ordre de 35% sur les masses annuelles de micropolluants sont estimees pour les composes dissous, en suivant la methodologie actuelle. Pour la mesure des composes adsorbes, une modification du systeme de prelevement est souhaitable pour limiter les incertitudes. Dans le cas des autres cours d’eau, la prise d’echantillons sur 24 heures pendant l’annee ne permet pas d’estimer correctement les charges annuelles (incertitudes de l’ordre de 60% meme avec 40 echantillons par an). L’etude de scenarios est fortement recommandee avant de se lancer dans des programmes de monitoring. La mise en place d’un guide ou d’une directive sur l’echantillonnage de composes diffus est fortement recommandee. Une demarche conduisant a la definition d'indicateurs de pollution diffuse d'origine agricole pour le classement de bassins versants est proposee, basee sur l’activite agricole et la vulnerabilite des bassins versants. Un test d’application a ete mene sur les bassins versants de la Chamberonne et de la Venoge, demontrant la faisabilite de la demarche en utilisant les outils et donnees disponibles dans le contexte lemanique. Les criteres et les poids a attribuer aux differents indicateurs doivent etre discutes par un groupe d’expert. A titre de conclusion, on constate que la mesure de micropolluants dans differents cours d’eau est consideree actuellement comme un but en soit, alors qu’il s’agit d’une information destinee a alimenter des outils de gestion pour preserver le milieu naturel. Ces outils font, a l’heure actuelle, cruellement defaut. Une meilleure planification des campagnes de mesure, basees sur des scenarios et des buts precis quant a l’utilisation des resultats a posteriori est absolument indispensable pour eviter d’accumuler des informations peu ou pas representatives. Une priorisation des bassins versants, en termes de pollution diffuse, est souhaitable sur le pourtour du lac Leman afin de cibler au mieux les actions a entreprendre pour preserver cet environnement.

6 citations

DissertationDOI
01 Jan 2015
TL;DR: The main goal of this thesis is to better represent input, structural, and output measurement errors in stormwater, wastewater, and sediment transport predictions to meliorate parameter estimation and prediction generation.
Abstract: Hydrological or drainage models can be valuable tools to support water management in urban environments. They can help to assess the characteristics of a catchment and to make predictions about its response (e.g. discharge). Unfortunately, parameters and results of these models are not perfect. These inaccuracies manifest themselves as model discrepancy, the so-called bias. Model bias represents the systematic deviation between model output and the real system response. There are two main causes of bias. First, there are errors in the input estimates, e.g. due to the insufficient coverage of pluviometers. Second, there are deficits in the model structure, e.g. due to the use of oversimplified empirical equations. Besides model bias, there are output measurement errors, e.g. due to imprecise flowmeters. Until now, a large proportion of hydrological studies implicitly neglected input and structural errors. Neglecting these can lead to: i) misrepresented output measurement errors, ii) incorrect parameter estimates which compensate for model discrepancy, and iii) predictions which underestimate the uncertainty. Furthermore, these approaches do not provide guidance for finding the reasons for bias. Therefore, they cannot support its reduction. This inappropriate error consideration can finally lead to faulty risk assessment, flawed evaluation of decision alternatives, and, consequently, impaired urban water management. More advanced error assessment techniques are therefore called for. The main goal of this thesis is to better represent input, structural, and output measurement errors. This can meliorate parameter estimation and prediction generation. The main thesis contributions are two. The first is a realistic description of the uncertainties in stormwater, wastewater, and sediment transport predictions. The second is a sound representation of errors in the rainfall inputs. Additionally, we discuss and compare different statistical methods used for hydrological inference. Finally, we also present a new tool to improve sewer flow monitoring. In the first part of this work, we adapt a bias description, originally coming from statistics, to runoff modeling. We represent model bias as an autocorrelated Gaussian process and propose different parameterizations of this process. This “upgraded” bias description is tested using a parsimonious model of a small stormwater catchment. Results show that accounting for bias makes runoff predictions more reliable (i.e. realistically more uncertain) than before. In part two, the bias description is further examined in a different case study consisting of a large wastewater catchment. We compare this error model with an alternative one. This second approach includes the bias within the model equations rather than in the output. This analysis corroborates our previous findings: the bias description can appropriately

6 citations


Cites background from "Parsimonious hydrological modeling ..."

  • ...These UDMs have to deal with systems that quickly and dramatically respond to precipitation (Coutu et al., 2012b) and that are more complex than stationary and idealized chemical reactors....

    [...]

Journal ArticleDOI
TL;DR: In this paper, a probabilistic model for predicting an annual number of storm overflow discharges is presented, which does not require the development of complex hydrodynamic catchment models.
Abstract: The paper presents an attempt to develop a probabilistic model for predicting an annual number of storm overflow discharges. Forecasting the occurrence of an overflow discharge event involved the application of the logistic regression, which does not require the development of complex hydrodynamic catchment models. The performed calculations showed that the logistic regression model can be successfully used to evaluate the performance of the emergency overflow weir. The resultant logit model eliminates the necessity to develop hydrodynamic models, to conduct continuous measurements of the flow intensity in the stormwater drainage system and to collect detailed information on the characteristics of the subcatchments within the analyzed catchment. The hydrodynamic model was used to simulate the annual number of discharges. The analysis of the results demonstrated that they are in the range of stochastic values, which indicates an application-related character of the method.

6 citations


Cites background from "Parsimonious hydrological modeling ..."

  • ...The assessment of the stormwater drainage system can also be based on hydrodynamic models (Vaes and Berlamont 1999, Lenadro et al. 2009, Coutu et al. 2012, Gamerith et al. 2011), with the SWMM (Storm Water Management Model) (Jang et al. 2007, Barco et al. 2008, Beling et al. 2011) being one of the…...

    [...]

01 Jan 2017
TL;DR: In this paper, the authors present a list of tables and abbreviations of figures and acknowledgements list of acknowledgements for each of the tables and the abbreviations used in the tables.
Abstract: ............................................................................................................................................. v List of tables ...................................................................................................................................... xi List of figures ................................................................................................................................... xii List of abbreviations ....................................................................................................................... xiv Acknowledgements ......................................................................................................................... xv Chapter

4 citations


Cites background from "Parsimonious hydrological modeling ..."

  • ...IUWS models are especially suited for projects where the focus is the catchment outlet (i.e. treatment plants or outfalls) (Coutu et al., 2012, Vanrolleghem et al., 1996b)....

    [...]

References
More filters
Book
01 Jan 1998
TL;DR: In this paper, an updated procedure for calculating reference and crop evapotranspiration from meteorological data and crop coefficients is presented, based on the FAO Penman-Monteith method.
Abstract: (First edition: 1998, this reprint: 2004). This publication presents an updated procedure for calculating reference and crop evapotranspiration from meteorological data and crop coefficients. The procedure, first presented in FAO Irrigation and Drainage Paper No. 24, Crop water requirements, in 1977, allows estimation of the amount of water used by a crop, taking into account the effect of the climate and the crop characteristics. The publication incorporates advances in research and more accurate procedures for determining crop water use as recommended by a panel of high-level experts organised by FAO in May 1990. The first part of the guidelines includes procedures for determining reference crop evapotranspiration according to the FAO Penman-Monteith method. These are followed by updated procedures for estimating the evapotranspiration of different crops for different growth stages and ecological conditions.

21,958 citations


"Parsimonious hydrological modeling ..." refers background or methods in this paper

  • ...…is computed through a modified version of the Blaney–Criddle equation (e.g., Doorenbos and Pruitt, 1975): ETmax ¼ aþ b½pð0:46Tþ 8:13Þ ; ð6Þ where a and b are fitting parameters and p is the mean annual percentage of daytime hours, which varies only with latitude (Allen et al., 1998)....

    [...]

  • ...where a and b are fitting parameters and p is the mean annual percentage of daytime hours, which varies only with latitude (Allen et al., 1998)....

    [...]

Journal ArticleDOI
TL;DR: In this article, the principles governing the application of the conceptual model technique to river flow forecasting are discussed and the necessity for a systematic approach to the development and testing of the model is explained and some preliminary ideas suggested.

19,601 citations

01 Jan 1979
TL;DR: In this paper, a hydrological forecasting model is presented that attempts to combine the important distributed effects of channel network topology and dynamic contributing areas with the advantages of simple lumped parameter basin models.
Abstract: A hydrological forecasting model is presented that attempts to combine the important distributed effects of channel network topology and dynamic contributing areas with the advantages of simple lumped parameter basin models. Quick response flow is predicted from a storage/contributing area relationship derived analytically from the topographic structure of a unit within a basin. Average soil water response is represented by a constant leakage infiltration store and an exponential subsurface water store. A simple non-linear routing procedure related to the link frequency distribution of the channel network completes the model and allows distinct basin sub-units, such as headwater and sideslope areas to be modelled separately. The model parameters are physically based in the sense that they may be determined directly by measurement and the model may be used at ungauged sites. Procedures for applying the model and tests with data from the Crimple Beck basin are described. Using only measured and estimated parameter values, without optimization, the model makes satisfactory predictions of basin response. The modular form of the model structure should allow application over a range of small and medium sized basins while retaining the possibility of including more complex model components when suitable data are available.

6,158 citations

Journal ArticleDOI
TL;DR: In this paper, a hydrological forecasting model is presented that combines the important distributed effects of channel network topology and dynamic contributing areas with the advantages of simple luminescence.
Abstract: A hydrological forecasting model is presented that attempts to combine the important distributed effects of channel network topology and dynamic contributing areas with the advantages of simple lum...

4,668 citations

Journal Article

3,364 citations

Frequently Asked Questions (11)
Q1. What are the main physical processes driving the discharge at the two basin end-points in this?

The dominant physical processes driving water discharge at the two basin end-points in this study are Hortonian runoff, evapotranspiration, and gravity-driven percolation to groundwater. 

Two important modeling assumptions are: (i) the pipe network is replaced by an underground impervious area and thus overland flow and pipe discharge can be together modeled as a fast discharge linear reservoir, and (ii) the water diverted out of the sewer system through the different CSOs can be combined together through the hydraulic discharge function of a representative CSO. 

Most popular urban hydrological models used in research and engineering (e.g., MOUSE (Hernebring et al., 2002), SWMM3) are spatially distributed with link-node drainage networks. 

In this study, a hierarchical physically based storage and transmission model was designed as an alternative means for simulating continuous flow dynamics in complex engineered urban basins. 

In addition, the hydrological model integrates functions that aim to reproduce characteristic daily variations of dry weather flow to the WWTP. 

Detailed modeling of drainage systems is often deemed necessary because of the complexity of flow paths in urban catchments (Cantone and Schmid, 2011; Gironás et al., 2009). 

The type of precipitation is determined based on a temperature threshold (DeWalle and Rango, 2008; Schaefli et al., 2005): when T is above the threshold Tcr , precipitation occurs as rain, otherwise precipitation is frozen. 

This CSO, the closest CSO to the WWTP, is responsible for more than a third of all CSO discharge, and is typically the first to become operational in storms (e-dric.ch, 2008). 

During dry weather, discharges arriving at the WWTP inlet are determined mainly by two phenomena: (i) infiltration of groundwater into the pipe network (see Section 2.2 and Dupont et al. (2006); Göbel et al. (2004)) and, (ii) water use and consequent wastewater production. 

It is a typical urban catchment, where much water comes from toilets, washing, industry and other uses, rather than directly from natural sources. 

Saturation excess was not implemented in their modeling scheme as the authors considered an unlimited reservoir height – i.e., the reservoir is never full – and this could lead to underestimation of surface runoff (Buda et al., 2009; MartínezMena et al., 1998; Nachabe et al., 1997).