scispace - formally typeset
Open AccessProceedings ArticleDOI

Performance Characterization of Spark Workloads on Shared NUMA Systems

Reads0
Chats0
TLDR
This paper explores how Spark-based workloads are impacted by the effects of NUMA-placement decisions, how different Spark configurations result in changes in delivered performance, how the characteristics of the applications can be used to predict workload collocation conflicts, and how to improve performance by collocating workloads in scale-up nodes.
Abstract
As the adoption of Big Data technologies becomes the norm in an increasing number of scenarios, there is also a growing need to optimize them for modern processors. Spark has gained momentum over the last few years among companies looking for high performance solutions that can scale out across different cluster sizes. At the same time, modern processors can be connected to large amounts of physical memory, in the range of up to few terabytes. This opens an enormous range of opportunities for runtimes and applications that aim to improve their performance by leveraging low latencies and high bandwidth provided by RAM. The result is that there are several examples today of applications that have started pushing the in-memory computing paradigm to accelerate tasks. To deliver such a large physical memory capacity, hardware vendors have leveraged Non-Uniform Memory Architectures (NUMA). This paper explores how Spark-based workloads are impacted by the effects of NUMA-placement decisions, how different Spark configurations result in changes in delivered performance, how the characteristics of the applications can be used to predict workload collocation conflicts, and how to improve performance by collocating workloads in scale-up nodes. We explore several workloads run on top of the IBM Power8 processor, and provide manual strategies that can leverage performance improvements up to 40% on Spark workloads when using smart processor-pinning and workload collocation strategies.

read more

Content maybe subject to copyright    Report

Performance Characterization of Spark Workloads
on Shared NUMA Systems
Shuja-ur-Rehman Baig
, Marcelo Amaral
, Jord
`
a Polo
, David Carrera
{shuja.baig, marcelo.amaral, jorda.polo, david.carrera}@bsc.es
Universitat Polit
`
ecnica de Catalunya (UPC)
Barcelona Supercomputing Center (BSC)
University of the Punjab (PU)
Abstract—As the adoption of Big Data technologies becomes
the norm in an increasing number of scenarios, there is also a
growing need to optimize them for modern processors. Spark
has gained momentum over the last few years among companies
looking for high performance solutions that can scale out across
different cluster sizes. At the same time, modern processors
can be connected to large amounts of physical memory, in
the range of up to few terabytes. This opens an enormous
range of opportunities for runtimes and applications that aim
to improve their performance by leveraging low latencies and
high bandwidth provided by RAM. The result is that there are
several examples today of applications that have started pushing
the in-memory computing paradigm to accelerate tasks. To deliver
such a large physical memory capacity, hardware vendors have
leveraged Non-Uniform Memory Architectures (NUMA).
This paper explores how Spark-based workloads are impacted
by the effects of NUMA-placement decisions, how different Spark
configurations result in changes in delivered performance, how
the characteristics of the applications can be used to predict
workload collocation conflicts, and how to improve performance
by collocating workloads in scale-up nodes. We explore several
workloads run on top of the IBM Power8 processor, and provide
manual strategies that can leverage performance improvements
up to 40% on Spark workloads when using smart processor-
pinning and workload collocation strategies.
Index Terms—Performance, Modeling, Characterization,
Memory, NUMA, Spark, Benchmark
I. INTRODUCTION
Nowadays, due to the growth in the number of cores in
modern processors, parallel systems are built using Non-
Uniform Memory Architecture (NUMA), which has gained
wide acceptance in the industry, setting the new standard for
building new generation enterprise servers. These processors
can be connected to large amounts of physical memory, in the
range of up to a couple of terabytes for the time being. This
opens an enormous range of opportunities for runtimes and
applications that aim to improve their performance by leverag-
ing low latencies and high bandwidth provided by RAM. The
result is that today there are several examples of applications
that have started pushing the in-memory computing paradigm
to accelerate tasks.
To deliver such a large physical memory capacity, sockets
in NUMA systems are connected through high performance
connections and each socket can have multiple processors
with its own memory. A process running on a NUMA system
can access the memory of its own node as well remote node
where the latency of memory accesses on remote nodes is
significantly high compared to local memory accesses [1].
Ideally, memory accesses are kept local in order to avoid
this latency and contention on interconnect links. Moreover,
the bandwidth of memory accesses to last-level caches and
DRAM memory also depends on the access type that is
local or remote. From the NUMA perspective, people want
to learn whether NUMA topology can meet the challenges of
in-memory computing frameworks, and if not, what kinds of
optimizations are required.
At the same time, as the adoption of Big Data technologies
becomes the norm in many scenarios, there is a growing
need to optimize them for modern processors. Spark [2] has
gained momentum over the last few years among companies
looking for high performance solutions that can scale out
across different cluster sizes. To achieve a good performance
for in-memory computing frameworks on a NUMA system,
there is a need to understand the topology of the interconnect
between processor sockets and memory banks. Additionally,
while a NUMA architecture can provide very high memory
capacity to the applications, it also implies the additional
complexity of letting the Operating System take care of many
critical decisions with respect to where data is physically
stored and where are processes accessing that data placed. This
fact may have no impact for many applications that are not
memory intensive, whereas memory-bound applications can be
seriously impacted by these decisions in terms of performance.
This paper explores how Spark-based in-memory computing
workloads are impacted by the effects of NUMA architecture,
how different Spark configurations result in changes in deliv-
ered performance, how the characteristics of the applications
can be used to predict workload collocation conflicts, and
how to leverage memory-consumption patterns to smartly
co-locate workloads in scale-up nodes. The evaluation also
characterizes several workloads running on top of the IBM
Power8 processor, and provides strategies that can lead to
performance improvements of up to 40% on Spark workloads
when using smart processor-pinning and workload collocation
strategies.
In summary, the main contributions of this paper are the
following:
A characterization of three representative memory-
intensive Spark workloads across multiple software con-
© 2018 IEEE. Personal use of this material is permitted. Permission from IEEE must be
obtained for all other uses, in any current or future media, including reprinting/
republishing this material for advertising
or promotional purposes, creating new collective
works, for resale or redistribution to servers or lists, or reuse of any copyrighted
component of this work in other works.

figurations on top of a modern NUMA processor (IBM
Power 8). The study illustrates how these workloads re-
quire a high level of concurrence to achieve full processor
utilization when running in isolation, but at the same
time they are limited by the processor memory bandwidth
when such levels of concurrence is reached, resulting in
poor performance and resource underutilization.
An evaluation of how process and memory binding
to NUMA nodes can provide means to improve the
performance of memory-intensive Spark workloads by
reducing the competition among software threads on high
concurrency situations.
Propose smart workload co-location strategies that lever-
age process and memory binding to NUMA nodes as
a mechanism to improve performance and resource uti-
lization for modern NUMA processors running memory-
intensive workloads.
The rest of the paper is organized as follows. Sections II
and III provide technological background as well as set
the state of the art for the work presented in this paper.
Section IV introduces the evaluation methodology used for
the experiments. Sections V, VI and VII describe experiments
performed to support the conclusions presented in this work.
Finally, Section VIII presents the conclusions to the work.
II. BACKGROUND
A. Apache Spark
Apache Spark [2] is a popular open-source platform for
large-scale in-memory data processing developed at UC
Berkeley. Spark is designed to avoid the file system as much
as possible, retaining most data resident in distributed memory
across phases in the same job. Spark uses Resilient Distributed
Datasets (RDDs) [3] which are immutable collections of ob-
jects spread across a cluster and hides the details of distribution
and fault-tolerance for a larger collection of items. Spark
provides a programming interface based on the two high-
level operations i) transformations ii) actions. Transformations
are lazy operations that create new RDDs. Actions launch a
computation on RDDs to return a value to the application or
write data to the distributed storage system. When a user runs
an action on an RDD, Spark first builds a directed acyclic
graph (DAG) of stages. Next, it splits the DAG into stages that
contain pipelined transformations with dependencies. Further,
it divides each stage into tasks. A task is a combination of
data and computation. Spark executes all the tasks of a stage
before going to next stage. Spark maintains a pool of executor
threads which are used to execute the tasks in parallel.
B. IBM Power 8
We run all the experiments in the IBM Power System 8247-
42L, which is 2-way 12-core IBM Power8 machine with all
cores at 3.02GHz and with each core able to run up to 8
Simultaneous Multi-Threading (SMT) [4]
Each Power8 processor is composed of two memory regions
(i.e NUMA node) with 6 cores and their own memory con-
troller and 256GB of RAM. The Power8 processor includes
four cache levels, consisting of a store-through L1 data cache,
a store-in L2 cache, an eDRAM-based L3 cache with a per-
core capacity of 64 KB, 512KB, and 8 MB, respectively. The
fourth cache level has 128 MB and consists of eight external
memory chips called Centaur (which is a DDR3 memory).
1
2
3 6
5
4
230.4 GB/s
8 * 19.2 = 153.6 GB/s read; 8 * 9.6 =76.8 GB/s write;
mem. bandwidth per socket=230.4 GB/s
256 GB
1
2
3 6
5
4
256 GB
1
2
3 6
5
4
230.4 GB/s
256 GB
1
2
3 6
5
4
256 GB
Fig. 1: Power8 NUMA architecture
Because of the main memory is connected to the processor
using separate links for reading and write operations, with
two links for memory reads and one link for memory writes,
the system has asymmetric read and write bandwidth. The
connection between the processor with the memory is com-
posed of 8 links, with a link offering 9.6 GB/s write and 19.2
GB/s read bandwidth. Therefore, the system has in total four
NUMA nodes, 192 virtual cores, 1 TB of RAM and a total of
230.4 GB/s of sustainable memory bandwidth per socket, as
illustrated in Figure 1. For the software stack, the machine is
configured with a Ubuntu 16.10, kernel 4.4.0-47-generic, IBM
java version 1.8.0 and Apache Spark 1.6.1.
III. RELATED WORK
Although there have been several research efforts to in-
vestigate and mitigate the impact of NUMA on workload
performance, this topic is still gaining traction in the literature
in recent years [5], [6], [7], [8], [9], [10] [11], [12], [13]. These
works characterize some key sources of workload performance
degradation related to NUMA (such as additional latencies
and possibly lower memory bandwidth because of remote
memory access and contentions on the memory controller,
bus connections or cache contention), and propose OS task
placement strategies for mitigating remote memory access.
But the characterization of Spark workloads on IBM Power8
systems and placement strategies for co-scheduled application
is still roughly understood.
For example, [6] has characterized the NUMA performance
impact related to remote memory access introduced by the OS
when performing task re-scheduling or load balancing. While
this work proposed an effective approach to mitigating remote
memory access and cache contention, it is not application-
driven and does not have a holistic view of all applications to
define efficient workloads co-scheduling on NUMA systems.
In our work, we demonstrate the potential benefits from man-
ual binding strategies when co-scheduling multiple workloads
on NUMA systems.

Another example is the work of [14], where the authors
characterized the performance impact of NUMA on graph-
analytics applications. They present an approach to minimize
remote memory access by using graph-aware data allocation
and access strategies. While this work presents an application-
driven investigation, it lacks the analyze of memory-intensive
Spark workloads and workload collocation.
The most related works to our work are the [15] and
[16]. In the former, the authors quantify the impact of data
locality on NUMA nodes for Spark workloads on Intel Ivy
Bridge server. In the later, the authors evaluate the impact
of NUMA locality on the performance of in-memory data
analytics with Spark on Intel Ivy Bridge server. In both
papers, they run benchmarks with two configurations a) Local
DRAM b) Remote DRAM. In Local DRAM, they bound Spark
process to processor 0 and memory node 0 and in Remote
DRAM, they bound the Spark process to processor 0 and
memory node 1. Then, they compare the results to evaluate the
performance impact of NUMA. While those works present a
detailed performance characterization of Spark workloads on
NUMA systems on an Intel Ivy Bridge server, the NUMA per-
formance characterization of IBM Power8 systems is still not
understood. Moreover, their work does not present the NUMA
impact of optimally binding the workloads versus leaving the
OS allocating the resources. Also, they do not evaluate the
performance benefits of performing manual binding for co-
scheduled Spark workloads as we present in this paper.
IV. METHODOLOGY
This section describes how the study on the impact of
NUMA topology on in-memory data analytics workloads has
been performed, as well as the rationale behind the experi-
ments evaluated in the following sections.
A. Workloads
The experiments presented in this paper are based on Spark-
Bench [17], which is a benchmark suite developed by IBM and
widely tested in Power8 systems. From the range of available
workloads provided by the benchmark, Support Vector Ma-
chines (SVM), PageRank, and Spark SQL RDDRelation have
been selected for the evaluation. These workloads are well-
known in the literature, and combine different characteristics
to cover a large range of possible configurations. Dataset size
for SVM, SQL and PageRank is 47, 24, and 17 GB and
number of partitions are 376, 192 and 136 respectively for
all experiments.
B. Experimental Setup
Since the goal of this paper is to evaluate the perfor-
mance of Spark workloads on NUMA hardware, all the
experiments are conducted in a single machine; the charac-
teristics of the machine’s architecture are described in Sec-
tion II-B. For simplicity, Spark is configured in the standalone
mode [18], To control the number of cores, memory, and
the number of executors of each worker, the parameters
SPARK_WORKER_CORES, SPARK_WORKER_MEMORY, and
parameter value
spark.serializer org.apache.spark.serializer.KryoSerializer
spark.rdd.compress FALSE
spark.io.compression.codec lzf
storage level MEMORY AND DISK
spark.driver.maxResultSize 2 gb
spark.driver.memory 5 gb
spark.kryoserializer.buffer.max 512m
TABLE I: Spark configuration parameters
SPARK_EXECUTOR_MEMORY [18] are used, respectively. All
the other parameters and values used to configure Spark,
during the experiments execution described later in this paper,
are summarized in Table I.
Hardware counters have been used to collect most real-
time information from experimental executions, using the
perfmon2 [19] library. Memory bandwidth is calculated based
on the formula defined in [20]. For CPU usage, memory usage,
and context switches, the vmstat tool has been used. To collect
information about NUMA memory access, the numastat is
used. Finally, the numactl command has been used to bind
a workload in a set of CPUs or in memory regions (e.g. in
a NUMA node); the nB nomenclature is used to describe
different binding configurations, where n is the number of
assigned NUMA nodes, e.g. 1B for workloads bound to 1
NUMA node, 2B for workloads bound to 2 NUMA nodes,
etc.
V. EXPERIMENT 1: WORKLOAD CHARACTERIZATION
This experiment consists of a performance characterization
of Spark workloads, changing the configuration parameters of
Spark itself and observing the impact of different configura-
tions in terms of completion time and resource consumption.
The goal is to find which configurations lead to optimal
performance, e.g. which number of cores per Spark worker,
and/or the number of workers per application. Since this
experiment aims at defining the software configuration, there
is no other kind of hardware tuning involved; the OS performs
its default resource allocation decisions. More specifically, this
experiment analyzes the effect of the software configuration in
the resource usage intensiveness and possible speedups for the
workloads described in Section IV-A.
As described in Section II-B, the machine used for the
experiments has 4 NUMA nodes, 192 virtual cores, and 1TB
of main memory. Thus, this experiment varies the number
of cores, workers, and memory up to the total amount of
resources (cores and memory) available in this machine. Table
II describes all combinations of the amount of resources
allocated to all workloads in this experiment. The amount of
memory ranges from 5 up to 250GB per worker, the number
workers vary from 4 up to 192 workers. Depending on the
number of workers, the number of virtual cores ranges from 1
up to 192. If the total number of workers is 192, each one will
have only one virtual core. Note that, by creating this matrix
of experiments, we want to see at which configuration, the
operating system produce optimal results for each workload
type in terms of completion time. We assign memory to Spark

w
e
m
t
m
a
t
s
w
core per worker
1 2 3 4 6 8 12 16 24 48
250 1000 4 4 8 12 16 24 32 48 64 96 192
125 1000 8 8 16 24 32 48 64 96 128 192
83 996 12 12 24 36 48 72 96 144 192
62 992 16 16 32 48 64 96 128 192
41 984 24 24 48 72 96 144 192
31 992 32 32 64 96 128 192
20 960 48 48 96 144 192
15 960 64 64 128 192
10 960 96 96 192
5 960 192 192
TABLE II: Experiment 1: Evaluated software configurations
(wem is worker and executor memory; tma is total memory
allocated; and tsw is total Spark workers)
workload
total
workers
core
per
worker
total
cores
allocated
worker
executor
memory
total
memory
allocated
Execution
Time (sec)
SVM 24 8 192 41 984 323.71
SQL 4 12 48 250 1000 206.82
PageRank 12 8 96 83 996 748.08:
TABLE III: Experiment 1: Best configuration when optimizing
for completion time
worker and executor by dividing 1000 by a total number of
workers in the experiment and take the integral part only; thus,
the amount of memory ranges from 960GB to 1000GB. Some
amount of memory is intentionally left for the OS and other
processes (e.g spark driver, master) to avoid the slowdown
effects not related to NUMA.
In Spark, a software configuration defines the number of
workers, the number virtual cores and the amount of memory
per worker that is assigned to a specific workload. These
software resources need to match the hardware configuration
of the node used to run the workloads. But not all applications
can take advantage of an increasing amount of resources and
therefore it is not always the case that one single software
configuration optimizes the performance of a Spark Workload
for a given hardware setup.
Table III summarizes the optimal configurations that found
for the three workloads considered in this experiment. As it
can be seen, every workload achieves maximum performance
using a different software configuration, being SVM the ap-
plication that can take advantage of more threads in parallel,
followed by PageRank and finally SQL. It is remarkable that
even configurations with a similar number of cores allocated
tend to deliver different performance for similar configurations
of number of workers and number of cores per worker. For
instance, SQL works best with fewer workers and more cores
per worker and SVM gets the best performance when more
workers and fewer cores per worker are assigned. This is due
to SQL is more impacted because of thread locks and cache
contention than the SVM. Hence, SQL benefits from fewer
threads competing for resources. Additionally, because the
JVM includes additional overheads (e.g. garbage collection),
more layers for resource management and memory indexing, it
is not beneficial to have several workers with only one virtual
core.
To explain the root cause of the performance delivered
by the different configurations, Tables IV , V and VI also
show the executions times in seconds obtained for SVM ,
SQL, and PageRank respectively when using all combinations
of software configurations, but in this case, we color each
configuration according to the relative performance delivered
compared to the optimal configuration found for that particular
workload. Based on this property we classify configurations
in different groups:
Within 10% of optimal: configurations for which comple-
tion time is very close to the best execution time observed
for that particular workload.
Low CPU Usage: configurations for which CPU usage is
clearly below the observed CPU usage for the workload.
These configurations use a too low number of cores or
workers that are not enough to fully utilize the available
compute resources and produce optimal results.
High CPI and Context Switches: executions where cycles
per instruction (CPI) and context switches are greater than
the observed values for the optimal configuration. This is
due to more executors which execute more threads to pro-
cess the tasks. Moreover, executors need to communicate
with each other and also with drivers. Remote memory
access also impacts the CPI since it requires more CPU
cycles to be performed than local access. This leads to
increase in communication overhead. So in result, we see
an increase in context switches and CPI.
High L3 misses: configurations where L3 cache misses
are greater than in the optimal configuration. This group
is only defined for SVM as it is the only workload for
which this behavior was observed.
Low Memory Bandwidth: configurations where memory
bandwidth usage is less than the observed value for the
optimal configuration.
Require more investigation: configurations where values
of metrics are within the range of optimal region but
the completion time is outside of 10%. The experiments
in this region require further investigation and it could
not be determined so far the reason for the performance
differences with the optimal configuration.
core per worker
w
1 2 3 4 6 8 12 16 24 48
4 1437.95 1018.4 816.87 698.34 597.13 515.9 501.78 464.26 472.28 375.2
8 759.16 555.26 478.23 411.91 366.39 357.54 347.49 359.18 360.48
12 531.9 422.6 420.24 382.46 386.72 332.44 353.68 339.51
16 458.58 412.85 385.79 352.69 347.22 333.63 336.26
24 413.1 394.72 371.6 358.46 354.17 323.71
32 405.16 389.16 369.81 361.36 341.53 Within 10% of optimal
48 442.8 427.85 398.61 370.78 Low CPU usage
64 546.11 522.3 569.83 High CPI and Context Switches
96 1118.77 922.01 High L3 misses
192 1980.92 Require more investigation
TABLE IV: SVM completion time (seconds) groups
The second objective of this experiment was to characterize
the CPU, Memory Footprint and Memory Bandwidth demands
of each one of the workloads of study. For this purpose, we
monitored the execution of the workloads when the optimal
software configuration was in use and plotted the average
resource consumption in Figure 2. As it can be seen, results
show that memory usage is 457.7 GB, 364.3 GB and 329.4
GB for SVM, SQL and PageRank respectively and shows the

core per worker
w
1 2 3 4 6 8 12 16 24 48
4 1148.69 616.46 427.64 338.64 288.48 231.35 206.82 229.65 235.82 238.99
8 590.22 335.51 264.95 255.86 220.93 209.33 259.7 236.06 220.27
12 426.48 270.56 244.68 229.2 217.48 223.57 296.5 228.74
16 375.65 288.92 242.9 247.26 241.71 245.1 240.67
24 347.14 284.32 264.94 254.9 282.7 246.8
32 347.65 293.96 268.68 287.77 262.32
48 328.69 299.43 285.76 282.98 Within 10% of optimal
64 324.99 307.44 307.54 Low CPU usage
96 349.75 355.28 High CPI and Context Switches
192 591.11 Require more investigation
TABLE V: SQL completion time (seconds) groups
core per,worker
w
1 2 3 4 6 8 12 16 24 48
4 4771.33 2028.77 1532.34 1188.68 1016.5 1000.84 2358.19 2207.09 1733.52 3186.17
8 2517.32 1145.33 997.91 902.02 920.09 861.18 816.06 1148.35 1319.35
12 1580.25 980.71 911.1 785.84 788.52 748.08 1028.29 1010.76
16 1379.76 921.87 871.61 862.69 766.9 925.91 877.9
24 1175.22 909.71 866.08 843.5 780.68 812.44
32 1085.66 875.52 907 1095.11 880.61 Within 10% of optimal
48 996.54 858.22 760.27 767.63 Low CPU usage
64 1183.04 1143.43 912.03 High CPI and Context Switches
96 1447.05 1142.42 Low Memory Bandwidth
192 2918.32 Require more investigation
TABLE VI: PageRank completion time (seconds) groups
Fig. 2: Experiment 1: CPU Usage (percentage) and Memory
Bandwidth (GB/s) for optimal configuration
average usage of user CPU time and memory bandwidth for
these workloads when the optimal software configuration is
in use. As it can be observed, SVM is constrained by the
high CPU usage, reaching around 80% for the user CPU time
only, that when added to the system and wait CPU times tops
to about 100% CPU usage, which is the actual performance
bottleneck.
SQL is a more interesting case because CPU and Memory
Bandwidth usage are really low for the fastest configuration,
and no other resource is apparently acting as a bottleneck. In
practice, what is avoiding the total CPU usage to go higher
is the fact that the number of threads that are spawn in this
configuration (only 48) is well below the number of hardware
threads offered by the system. Therefore, only a third of
the hardware threads are in use and that is why the average
CPU utilization is shown to be low: several hardware threads
are idle. Intuition would say that increasing the number of
threads would increase the performance, but in practice what
is observed in the logs of other experiments is that as soon
as the number of threads goes higher the memory bandwidth
dramatically increases, quickly becoming the bottleneck at
many stages during the execution. The bottom line is that
the OS is not able to correctly manage the threads for this
workload, creating memory access patterns that saturate the
memory links of the P8 processor.
Finally, PageRank is in the same situation: the optimal
configuration involves 96 software threads only, while the
system offers 192 hardware threads. In practice, what it
means is that the reported CPU utilization is low. Intuition
again would point in the direction of increasing the number
of software threads, but when that direction is taken, logs
show that the additional software threads start competing for
memory bandwidth because they exhibit worse memory access
patterns, and saturate the memory links.
In summary, this experiment has shown two cases in which
not all hardware threads could be exploited because in that
case the memory access patterns across NUMA nodes were
hitting a memory bandwidth bottleneck. This is an interesting
result because opens a door to smart workload collocation
strategies that will be explored in the following experiments.
VI. EXPERIMENT 2: BINDING TO NUMA NODES
Allocating more NUMA nodes to a workload has the
potential to increase resources (such as memory bandwidth,
CPU, and memory) and possibly lower cache contention (due
to the availability of additional cores and cache), but it can also
involve a trade-off: using remote memory accesses and dealing
with bus contention, which can lead to slowdowns in some
scenarios. Binding, in this context, means Spark processes
(master and workers) will only have access to the resources
(cores and memory) of a particular set of NUMA nodes.
While the previous experiment selected the optimal software
configuration without binding, allowing the operating system
to make all decisions, this experiment selects the optimal
software configuration when binding all 4 nodes (4B). Results
are also compared to the previous experiment so as to evaluate
the impact of binding.
In the previous experiment, the OS was responsible for
allocating all the resources, in this experiment we enforce
decisions to manually bind the workloads across the NUMA
nodes. The main motivation of performing the manual binding
is to mitigate the limitations defined in the previous experi-
ments. Manually binding the workloads can exploit better load
balancing, minimize thread migrations and remote memory
access. In order to verify those assumptions, we evaluate
the completion time of all workloads for different binding
configurations and compare with non-binding approaches (the
default allocation from OS). As explained in Section VI, the
workloads are bound in one NUMA node up to 4 (1B, 2B,
3B, 4B). The results of the optimal software configuration
considering the different number of NUMA nodes is shown
in Table VII. It also shows the comparison of the manual
binding with four NUMA nodes versus the default OS resource
allocation, labeled as NB.
The optimal configurations are 24 cores per worker and
1 worker per node for SQL, SVM, and PageRank when we
bound workloads to one NUMA node (1B). In case of 2B, the
optimal configurations are 8 cores per worker and 3 workers
per node for SQL, 6 cores per worker and 6 workers per node
for SVM and 4 cores per worker and 6 workers per node for
PageRank. Similarly, in case of 3B, the optimal configurations
are 8 cores per worker and 2 workers per node for SQL, 6 cores

Citations
More filters
Journal ArticleDOI

Real-Time Data Center's Telemetry Reduction and Reconstruction Using Markov Chain Models

TL;DR: This paper proposes and evaluates a system to efficiently reduce bandwidth and storage for telemetry data through real-time modeling using Markov chain based methods and compares with polynomial regression methods for reducing and reconstructing data.
Journal ArticleDOI

Adaptive priority-based data placement and multi-task scheduling in geo-distributed cloud systems

TL;DR: In this article, a data placement strategy based on RDD dynamic weight is introduced for the Spark frame of geo-distributed cloud systems, aiming at the data placement problem, and the algorithm can effectively adjust the weight of node data placement according to the actual task execution information, and shorten the task execution time.
Dissertation

Improving Resource Efficiency in Virtualized Datacenters

TL;DR: This thesis aims to find the right techniques and design decisions to build a scalable distributed system for the IoT under the Fog Computing paradigm to ingest and process data and explore the trade-offs and challenges in the design of a solution from Edge to Cloud to address opportunities that current and future technologies will bring in an integrated way.
Proceedings ArticleDOI

In-Memory Indexed Caching for Distributed Data Processing

TL;DR: In this paper , the authors introduce the Indexed DataFrame, an in-memory cache that supports a dataframe abstraction which incorporates indexing capabilities to support fast lookup and join operations.
References
More filters
Proceedings Article

Spark: cluster computing with working sets

TL;DR: Spark can outperform Hadoop by 10x in iterative machine learning jobs, and can be used to interactively query a 39 GB dataset with sub-second response time.
Proceedings Article

Resilient distributed datasets: a fault-tolerant abstraction for in-memory cluster computing

TL;DR: Resilient Distributed Datasets is presented, a distributed memory abstraction that lets programmers perform in-memory computations on large clusters in a fault-tolerant manner and is implemented in a system called Spark, which is evaluated through a variety of user applications and benchmarks.
Proceedings Article

A case for NUMA-aware contention management on multicore systems

TL;DR: The effects on performance imposed by resource contention and remote access latency are quantified and a new contention management algorithm is proposed and evaluated that significantly outperforms a NUMA-unaware algorithm proposed before as well as the default Linux scheduler.
Proceedings ArticleDOI

NUMA-aware graph-structured analytics

TL;DR: Polymer is described, a NUMA-aware graph-analytics system on multicore with two key design decisions, which shows that Polymer often outperforms the state-of-the-art single-machine graph-Analytics systems, including Ligra, X-Stream and Galois, for a set of popular real-world and synthetic graphs.
Proceedings ArticleDOI

SparkBench: a comprehensive benchmarking suite for in memory data analytic platform Spark

TL;DR: This paper presents SparkBench, a Spark specific benchmarking suite, which includes a comprehensive set of applications, including machine learning, graph computation, SQL query and streaming applications, and evaluates the performance impact of a key configuration parameter to guide the design and optimization of Spark data analytic platform.
Related Papers (5)
Frequently Asked Questions (18)
Q1. What have the authors contributed in "Performance characterization of spark workloads on shared numa systems" ?

This opens an enormous range of opportunities for runtimes and applications that aim to improve their performance by leveraging low latencies and high bandwidth provided by RAM. This paper explores how Spark-based workloads are impacted by the effects of NUMA-placement decisions, how different Spark configurations result in changes in delivered performance, how the characteristics of the applications can be used to predict workload collocation conflicts, and how to improve performance by collocating workloads in scale-up nodes. The authors explore several workloads run on top of the IBM Power8 processor, and provide manual strategies that can leverage performance improvements up to 40 % on Spark workloads when using smart processorpinning and workload collocation strategies. 

Because of manual binding minimizes remote memory access and local memory access has higher memory bandwidth and lower latency, some workload benefit from that. 

When processes are not bound to specific NUMA nodes, the OS is in charge of all placement decisions, which includes reactive migrations to balance the load. 

Because of the main memory is connected to the processor using separate links for reading and write operations, with two links for memory reads and one link for memory writes, the system has asymmetric read and write bandwidth. 

Hardware counters have been used to collect most realtime information from experimental executions, using the perfmon2 [19] library. 

the numactl command has been used to bind a workload in a set of CPUs or in memory regions (e.g. in a NUMA node); the nB nomenclature is used to describe different binding configurations, where n is the number of assigned NUMA nodes, e.g. 1B for workloads bound to 1 NUMA node, 2B for workloads bound to 2 NUMA nodes, etc. 

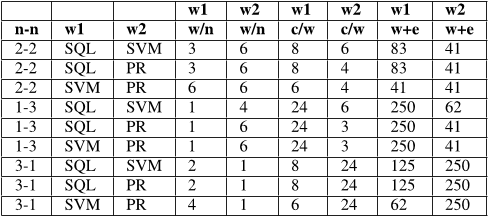
In particular, for any pair of workloads that is evaluated, the authors run both of them in a continuous loop of 90 minutes, from which the first 15 minutes are taken as a warm-up period and the final 15 minutes as a cool-down process. 

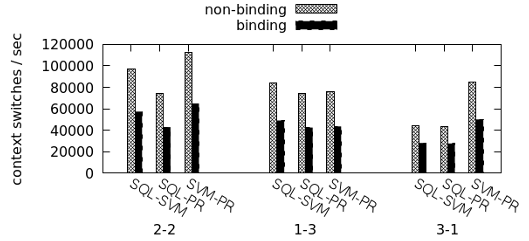
The obtained results show that binding spark processes to particular NUMA nodes can speed up the completion time of co-located workloads up to 1.39x at maximum due to less interconnect traffic, less remote memory access, and less context switches and CPI. 

As it can be observed, SVM is constrained by the high CPU usage, reaching around 80% for the user CPU time only, that when added to the system and wait CPU times tops to about 100% CPU usage, which is the actual performance bottleneck. 

The optimal configurations in case of 4B are 12 cores per worker and 1 worker per node for SQL, 8 cores per worker and 3 workers per node for SVM and 6 cores per worker and 3 workers per node for PageRank. 

SQL is a more interesting case because CPU and Memory Bandwidth usage are really low for the fastest configuration, and no other resource is apparently acting as a bottleneck. 

Some amount of memory is intentionally left for the OS and other processes (e.g spark driver, master) to avoid the slowdown effects not related to NUMA. 

This final experiment explores the benefits of workload colocation and process binding (cores and memory) as a mechanism to improve system throughput and increase resource utilization. 

only a third of the hardware threads are in use and that is why the average CPU utilization is shown to be low: several hardware threads are idle. 

Workload co-location is well-known to possibly slow down interference-sensitive applications, however, the impact of NUMA co-scheduled Spark workloads are still not completely understood. 

Considering following formula ( current node(s) + new node(s) / current node(s)), the theoretical speedup of allocating one new NUMA node to application with one current node would lead to a speedup of 2x. 

These configurations use a too low number of cores or workers that are not enough to fully utilize the available compute resources and produce optimal results. 

In practice, what is avoiding the total CPU usage to go higher is the fact that the number of threads that are spawn in this configuration (only 48) is well below the number of hardware threads offered by the system.