scispace - formally typeset
Search or ask a question
Book ChapterDOI

Personal Analytics Explorations to Support Youth Learning

01 Jan 2018-pp 145-163
TL;DR: In this article, personal analytics are used in the design of instruction for a high school student examining how sleep influences her mood and a sixth-grade class of students examining how deviations from typical walking behavior change distributional shape in plotted step data.
Abstract: While personalized learning environments often include systems that automatically adapt to inferred learner needs, other forms of personalized learning exist. One form involves the use of personal analytics in which the learner obtains and analyzes data about himself/herself. More known in informatics communities, there is potential for use of personal analytics for design of instruction. This chapter provides two cases of personal analytics learning explorations to demonstrate their range and potential. One case is of a high school student examining how sleep influences her mood. The other case is of a sixth-grade class of students examining how deviations from typical walking behavior change distributional shape in plotted step data. Both cases show how social support and direct experience with data correction are intimately involved in how youth can learn through personal analytics activities.

Summary (2 min read)

BACKGROUND

  • Many who have documented self-tracking and personal analytics practices identify 2007 as the year in which a community and sociotechnical movement (the “Quantified Self”) emerged in the Silicon Valley, with Wired magazine editors Kevin Kelly and Gary Wolf being attributed as primary initiators (Choe et al., 2014; Lee, 2014).
  • The two cases are also presented with an eye toward diversity to show the different kinds of data that could be obtained by youth and to demonstrate that personal analytics learning activities are usable with youth at different grade levels, with different levels of technology, and in different participation structures (i.e., working individually vs as a whole class).
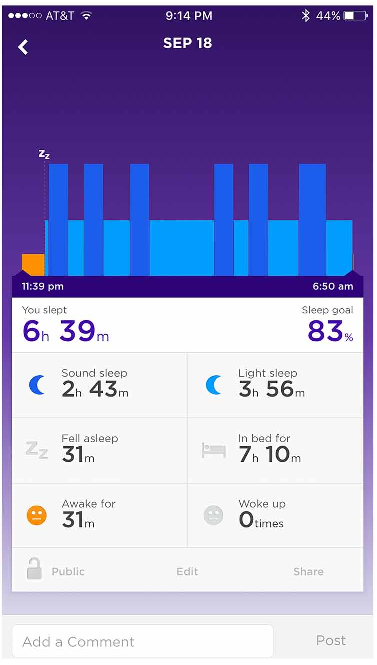
  • Immediately following, she began to consider a number of sleep variables that could impact her mood.
  • While other girls participating in the project shared their own observations, experiences, and difficulties with the devices that they had tried, Melissa proceeded to pay partial attention to them and also entering the new values she obtained from the Up device into the spreadsheet she had started the week prior.

Commentary on the Playground Walking Case

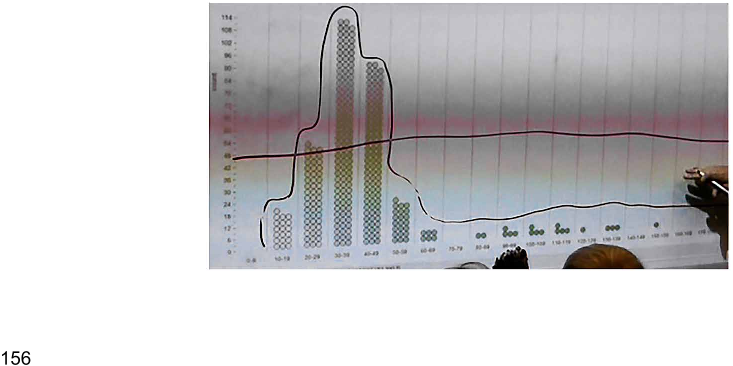
  • This in-class discussion about steps taken to get across the playground at school was not originally planned.
  • The authors had expected that students would walk normally and produce normally distributed data through this activity.
  • In the classroom, where there is a larger social setting in which multiple people are examining the data, gaining insight can come about by noticing what others can see and hearing how they explain the data.
  • This represents an important consideration for how personal analytics activities could be sensibly implemented in schools and other learning environments.
  • Thus, the authors suggest from this case that the combination of personal connection to the data, along with the software tool and the teacher’s facilitation of the discussion all jointly enabled the realization of a substantive learning opportunity.

CONCLUSION

  • The overarching aim of this chapter was to suggest that personal analytics approaches represent an important area of personalized learning in today’s digital ecosystem.
  • In contrast to other forms of personalized learning experience represented in this volume, the emphasis when using personal analytics for learning is to have the learner create data from their own activities and then be in the position of examining their own data.
  • What is to be taught and learned by students is not automatically determined nor recommended to them; it is encountered in the process of making sense of what the data say about the students and their experiences.
  • The first was of a high school student who participated in an afterschool program where she used a wearable device to explore possible relationships between her sleep and her mood.
  • According to their records, she seemed to get there.

Did you find this useful? Give us your feedback
Content maybe subject to copyright    Report

Digital Technologies and
Instructional Design for
Personalized Learning
Robert Zheng
University of Utah, USA
A volume in the Advances in Educational
Technologies and Instructional Design (AETID)
Book Series

Published in the United States of America by
IGI Global
Information Science Reference (an imprint of IGI Global)
701 E. Chocolate Avenue
Hershey PA, USA 17033
Tel: 717-533-8845
Fax: 717-533-8661
E-mail: cust@igi-global.com
Web site: http://www.igi-global.com
Copyright © 2018 by IGI Global. All rights reserved. No part of this publication may be reproduced, stored or distributed in
any form or by any means, electronic or mechanical, including photocopying, without written permission from the publisher.
Product or company names used in this set are for identification purposes only. Inclusion of the names of the products or
companies does not indicate a claim of ownership by IGI Global of the trademark or registered trademark.
Library of Congress Cataloging-in-Publication Data
British Cataloguing in Publication Data
A Cataloguing in Publication record for this book is available from the British Library.
All work contributed to this book is new, previously-unpublished material. The views expressed in this book are those of the
authors, but not necessarily of the publisher.
For electronic access to this publication, please contact: eresources@igi-global.com.
Names: Zheng, Robert, editor.
Title: Digital technologies and instructional design for personalized
learning / Robert Zheng, editor.
Description: Hershey, PA : Information Science Reference, [2018]
Identifiers: LCCN 2017024205| ISBN 9781522539407 (hardcover) | ISBN
9781522539414 (ebook)
Subjects: LCSH: Individualized instruction--Computer-assisted instruction. |
Instructional systems--Design.
Classification: LCC LB1031 .D54 2018 | DDC 371.39/4--dc23 LC record available at https://lccn.loc.gov/2017024205
This book is published in the IGI Global book series Advances in Educational Technologies and Instructional Design (AE-
TID) (ISSN: 2326-8905; eISSN: 2326-8913)

145
Copyright © 2018, IGI Global. Copying or distributing in print or electronic forms without written permission of IGI Global is prohibited.
Chapter 7
DOI: 10.4018/978-1-5225-3940-7.ch007
ABSTRACT
While personalized learning environments often include systems that automatically adapt to inferred
learner needs, other forms of personalized learning exist. One form involves the use of personal analytics
in which the learner obtains and analyzes data about himself/herself. More known in informatics com-
munities, there is potential for use of personal analytics for design of instruction. This chapter provides
two cases of personal analytics learning explorations to demonstrate their range and potential. One case
is of a high school student examining how sleep influences her mood. The other case is of a sixth-grade
class of students examining how deviations from typical walking behavior change distributional shape
in plotted step data. Both cases show how social support and direct experience with data correction are
intimately involved in how youth can learn through personal analytics activities.
INTRODUCTION
One widely recognized model of personalized learning involves using computational tools to exogenously
recognize and respond to the immediate conceptual needs of a learner and automatically adjusting the
learning environment accordingly; for instance, an intelligent tutoring system can infer the knowledge
state of a user and then present appropriate tasks and instructional content to move them closer to a more
expert-like understanding (e.g., Graesser, Chipman, Haynes, & Olney, 2005). Yet there are still several
other ways in which personalization could take form in a technology-supported learning environment.
As examples, consider how using personalized story scenarios that map onto studentsout-of-school
interests can boost student learning in mathematics (Walkington, 2015; Walkington, Petrosino, & Sher-
man, 2013) or how personalization can also be achieved and supported by providing youth with genera-
tive and expressive computational media where they can design and engineer artifacts that are specific
to their own interests and prior expertise (Peppler & Kafai, 2007). In this chapter, my goal is to further
Personal Analytics Explorations
to Support Youth Learning
Victor R. Lee
Utah State University, USA

146
Personal Analytics Explorations to Support Youth Learning
expand the space of personalized learning by highlighting what opportunities exist when students are
able to explore “personal analytics”.
Personal analytics (Ruckenstein, 2014; Wolfram, 2012) refers to a set of data-related practices that
have been associated with the area of personal informatics (Li, Dey, Forlizzi, 2010) and the Quantified
Self (Nafus & Sherman, 2014). All typically involve collecting and analyzing aggregates of data obtained
through “self-tracking” (Lee, 2017). The use of the term has generally varied depending on the scholarly
community (i.e., personal informatics is more common parlance in the information sciences). Arguably,
there are nuances that distinguish the terms, but for current purposes, it is acceptable to think of personal
analytics as being comparable to the kinds of analytics that one might do with website data but instead
do so with data about one’s own self. At its core, personal analytics is self-inquiry using data. While
data collection and inquiry about ones own self has been practiced for several years in a range of com-
munities (e.g., Kopp, 1988; Lee & Drake, 2013; Wallace, 1977, Wheeler & Reis, 1991), the widespread
availability of consumer-level mobile and wearable devices and automated data collection systems (such
as clickstream recording) has reduced some of the initial barriers associated with analyzing data about
one’s self (Lee, 2013) and popularized this approach. This has thus enabled some initial pioneering work
to integrate personal analytics routines and practices into the design of learning environments. Some
noteworthy examples include asking youth to use personal analytics data and gaming environments to
motivate healthier lifestyle behaviors (Ching & Schaefer, 2015) or to support interactive exhibit design
at settings such as zoos and museums (Lyons, 2015).
While some promising opportunities have been noted (Rivera-Pelayo, Zavharias, Müller, & Braun,
2012), much still remains to be understood about how educational designers can best support learning
that invites students to do the work of personal analytics. Part of this has to do with the disparity between
the most visible and noteworthy examples of expert-like learning through personal analytics and what
needs and challenges are encountered by novices. For example, noted polymath Stephen Wolfram (2013)
has presented some detailed cases and visualizations of his own personal analytics of email use, phone
calls, and meeting participation over the course of years. Power users who identify with the Quantified
Self movement (also known as QSelf-ers or QSers) regularly convene in major urban areas to share per-
sonal analytics projects that they have pursued and how that helped them to gain new insight and learn
about themselves (Choe, Lee, Lee, Pratt, & Kientz, 2014; Lee, 2014). Such examples are informative
and aspirational for the future, but they also presume proficiency with powerful visualization tools, flu-
ency with data and data representations, some formal understanding about correlational and potentially
experimental design, and instrumentation. Each of these could be, in a designed educational setting, a
set of learning goals on their own.
Moreover, personal analytics has been by and large dominated by an orientation toward using personal
data about one’s self to support planned behavior change, self-improvement, and performance optimi-
zation (Li et al., 2014). Empirical examination of adults who self-track and analyze their own personal
data actually suggests that the reasons for participation in self-tracking communities and activities are
actually more nuanced, with only a fraction of the broader population of self-trackers having aspirations
of behavior change in mind. Many are simply curious to see what possible stories come from their num-
bers or if their intuitions match an existing quantified scale (Epstein, Ping, Fogarty, & Munson, 2015).
Furthermore, the standards of scientific rigor are not always met nor understood by those who undertake
self-tracking and self-experimentation projects (Choe et al., 2014). With those observations in mind,
it is reasonable to expect that students and youth who are charged with performing personal analytics

147
Personal Analytics Explorations to Support Youth Learning
work to support their own learning may introduce other challenges or complications. Learning to read
graphs, for instance, is an ongoing challenge for many students (Leinhardt, Zaslavsky, & Stein, 1990).
Still, the idea of using data from and about students with those very same students holds appeal and
has been tantalizing enough for some to explore through educational research and design. The gap from
ideation to execution has only recently begun to be filled. This chapter is an effort to continue with that
gap-filling by presenting two cases of student learning activities with personal analytics obtained over
the course of a multi-year research program to explore the potential of personal analytics for youth
learning. The first case is of high-school student who participated in a multi-week afterschool program
where each participant was charged with embarking on her own personal analytics project. The goal
here was to modestly emulate what had been pursued in more advanced hobbyist practice (Choe et al.,
2014) and understand what supports were needed for youth to pursue similar endeavors. The second case
comes from a designed unit in a sixth-grade classroom where students worked continuously with data
from their own activities. In this second case, the data obtained were a count of steps required to walk
across the school playground and did not require sophisticated wearable devices. However, the case was
noteworthy in that the visualization of activity showed some abnormal walking behaviors and spurred
productive classroom discussion about distributions and how data were generated. Together, these two
cases illustrate some of the potentials for personal analytics to support learning, with different lessons
gleaned from each. The first hints at some of the supports that are needed and concerns that get raised
in the context of individual inquiry, but also provides the reader with a sense of what kinds of content
can be learned through personal analytics endeavors. The second demonstrates how the core commit-
ment of personal analytics – the examination of data about the self – can be sensibly integrated into a
classroom activity and how awareness of data creation can be conducive to classroom discussions about
visual representations of aggregated data.
BACKGROUND
Many who have documented self-tracking and personal analytics practices identify 2007 as the year in
which a community and sociotechnical movement (the “Quantified Self”) emerged in the Silicon Valley,
with Wired magazine editors Kevin Kelly and Gary Wolf being attributed as primary initiators (Choe et
al., 2014; Lee, 2014). Since that time, informal groups of self-trackers have appeared in over 100 cities
around the world, and an annual conference that brings together hobbyists, entrepreneurs, tool-makers,
medical professionals, and academic researchers boasts consistently strong attendance (i.e., a few hundred
attendees regularly). However, it is worth noting that like many activities popularized through the Silicon
Valley, self-tracking had actually existed in various forms for decades prior in academic communities
such as behavior analysis and organizational studies (Burns, 1954; Wallace, 1977; Wheeler & Reis, 1991).
Independent of the designated sociotechnical movement or prior behaviorist-oriented work, my re-
search group and I had been exploring student learning opportunities with wearable device-obtained data
about their own selves since 2008. From 2008 to 2017, we have been developing and pursuing integrated
and overlapping lines of educational research and development oriented toward personal analytics ap-
proaches to supporting teaching and learning. That has involved a number of design experiments (Cobb,
Confrey, diSessa, Lehrer, & Schauble, 2003) with youth working in small groups and collectively as full
classrooms (Lee & DuMont, 2010; Lee & Thomas, 2011). The two cases presented below come from
the broad data set obtained over those years in which different learning configurations and supports were

Citations
More filters
Proceedings ArticleDOI
21 Apr 2020
TL;DR: Re-Shape is presented and analyzed, a method to teach students about the ethical implications of data collection and use and allows students to collect, process, and visualize their physical movement data in ways that support critical reflection and coordinated classroom activities about data, data privacy, and human-centered systems for data science.
Abstract: Data has become central to the technologies and services that human-computer interaction (HCI) designers make, and the ethical use of data in and through these technologies should be given critical attention throughout the design process. However, there is little research on ethics education in computer science that explicitly addresses data ethics. We present and analyze Re-Shape, a method to teach students about the ethical implications of data collection and use. Re-Shape, as part of an educational environment, builds upon the idea of cultivating care and allows students to collect, process, and visualize their physical movement data in ways that support critical reflection and coordinated classroom activities about data, data privacy, and human-centered systems for data science. We also use a case study of Re-Shape in an undergraduate computer science course to explore prospects and limitations of instructional designs and educational technology such as Re-Shape that leverage personal data to teach data ethics.

32 citations


Cites background from "Personal Analytics Explorations to ..."

  • ...in the data based on their own experience” [23, 24, 41, 47, 63, 64]....

    [...]

Journal ArticleDOI
TL;DR: A theoretical framework is provided to characterize how prior experience is used as a resource in data sense-making when the data are about students’ own physical experiences and centralizes and interrogates the work of “remembering” prior experiences and articulates how remembering is involved in interpreting quantified self data.
Abstract: Given growing interest in K-12 data and data science education, new approaches are needed to help students develop robust understandings of and familiarity with data. The model of the quantified se...

11 citations


Cites background from "Personal Analytics Explorations to ..."

  • ...This has also been called personal analytics (Lee, 2018) or personal informatics (Li, Dey, & Forlizzi, 2010)....

    [...]

Journal ArticleDOI
14 Jan 2019
TL;DR: A topical intersection between the information and learning sciences is demonstrated, how self-tracking can be recruited for instructional settings is illustrated, and concerns that have emerged in the past several years as the technology related to activity tracking begins to be used for educational purposes are discussed.
Abstract: Purpose This paper aims to discuss research and design of learning activities involving activity tracking and wearable activity tracking technology. Design/methodology/approach Three studies are summarized as part of a program of research that sought to design new learning activities for classroom settings. The first used data from a qualitative interview study of adult athletes who self-track. The second used video excerpts from a designed learning activity with a group of fifth grade elementary students. The third study draws largely on quantitative assessment data from an activity tracking unit enactment in a rural sixth grade class. Findings Activity tracking appears to provide opportunities for establishing benchmarks and calibration opportunities related to intensity of physical activities. Those features of activity tracking can be leveraged to develop learning activities where elementary students discover features of data and how data are affected by different distributions. Students can show significant improvement related to statistical reasoning in classroom instructional units that centralize the use of self-tracked data. Originality/value As activity tracking is becoming a more ubiquitous practice with increased pervasiveness and familiarity with mobile and wearable technologies, this paper demonstrates a topical intersection between the information and learning sciences, illustrates how self-tracking can be recruited for instructional settings, and it discusses concerns that have emerged in the past several years as the technology related to activity tracking begins to be used for educational purposes.

11 citations

Proceedings ArticleDOI
13 Feb 2022
TL;DR: In this article , the authors designed a teaching method of Data Diaries, which consists of five representation assignments that move from visualizing to physicalizing personal data, with the aim of creating an interactive physicalisation.
Abstract: A growing body of work focuses on physicalisations based on personal, everyday data. Despite growing interest, little is known about how to educate people on their creation. We designed a teaching method of ’Data Diaries’, which consists of five representation assignments that move from visualising to physicalising personal data. The Data Diaries were used in a semester project, with the aim of creating an interactive physicalisation. We analysed the Data Diaries, written reports, and participant interviews. Our analysis shows that people need to overcome the challenge of using materiality to communicate data, which happens in four stages. Moreover, the materiality made participants realise that physicalisations do not focus on efficiency and accuracy, but on the story of the data, by referring to its origin, use of personal mappings, and reduction. As physicalisations blur the line between quantitative and qualitative, designing them engenders a change in our notion of ’data’.

5 citations

Book ChapterDOI
Robert Zheng1
01 Jan 2018
TL;DR: In this paper, the authors examine the literature relating to deep cognitive processes and the idiosyncratic features of digital technology that support learners' deep cognitive process in learning and propose guidelines pertaining to personalization with digital technology in regard to DCP.
Abstract: How to personalize learners’ learning with digital technology so that learners derive optimal experiences in learning is a key question facing learning scientists, cognitive psychologists, teachers, and professional instructional designers. One of the challenges surrounding personalization and digital technology is how to promote learners’ cognitive processes at a deeper level so that they become optimally engaged in critical and creative thinking, making inferences in learning, transferring knowledge to new learning situations, and constructing new knowledge during innovative learning process. This chapter examines the literature relating to deep cognitive processes and the idiosyncratic features of digital technology that support learners’ deep cognitive processes in learning. Guidelines pertaining to personalization with digital technology in regard to deep cognitive processing are proposed, followed by the discussions on future research with a focus on verifying the theoretical constructs proposed in the guidelines.

4 citations

References
More filters
Proceedings ArticleDOI
17 Sep 2011
TL;DR: Six kinds of questions people have about their data, why they ask these questions, how they answer them with current tools, and what kinds of problems they encounter are found and features that should be supported in personal informatics tools for which Ubicomp technologies can play an important role are identified.
Abstract: We live in a world where many kinds of data about us can be collected and more will be collected as Ubicomp technologies mature. People reflect on this data using different tools for personal informatics. However, current tools do not have sufficient understanding of users' self-reflection needs to appropriately leverage Ubicomp technologies. To design tools that effectively assist self-reflection, we need to comprehensively understand what kinds of questions people have about their data, why they ask these questions, how they answer them with current tools, and what kinds of problems they encounter. To explore this, we conducted interviews with people who use various kinds of tools for personal informatics. We found six kinds of questions that people asked about their data. We also found that certain kinds of questions are more important at certain times, which we call phases. We identified two phases of reflection: Discovery and Maintenance. We discuss the kinds of questions and the phases in detail and identify features that should be supported in personal informatics tools for which Ubicomp technologies can play an important role.

443 citations

Proceedings ArticleDOI
07 Sep 2015
TL;DR: A model characterizing tracker processes of deciding to track and selecting a tool, elaborate on tool usage during collection, integration, and reflection as components of tracking and acting are developed, thus identifying future directions for personal informatics design and research.
Abstract: Current models of how people use personal informatics systems are largely based in behavior change goals. They do not adequately characterize the integration of self-tracking into everyday life by people with varying goals. We build upon prior work by embracing the perspective of lived informatics to propose a new model of personal informatics. We examine how lived informatics manifests in the habits of self-trackers across a variety of domains, first by surveying 105, 99, and 83 past and present trackers of physical activity, finances, and location and then by interviewing 22 trackers regarding their lived informatics experiences. We develop a model characterizing tracker processes of deciding to track and selecting a tool, elaborate on tool usage during collection, integration, and reflection as components of tracking and acting, and discuss the lapsing and potential resuming of tracking. We use our model to surface underexplored challenges in lived informatics, thus identifying future directions for personal informatics design and research.

333 citations

Journal ArticleDOI
18 Feb 2014
TL;DR: This paper explores personal analytics from the perspective of self-optimization, arguing that the ways in which people confront and engage with visualized personal data are as significant as the technology itself.
Abstract: A field of personal analytics has emerged around self-monitoring practices, which includes the visualization and interpretation of the data produced. This paper explores personal analytics from the perspective of self-optimization, arguing that the ways in which people confront and engage with visualized personal data are as significant as the technology itself. The paper leans on the concept of the “data double”: the conversion of human bodies and minds into data flows that can be figuratively reassembled for the purposes of personal reflection and interaction. Based on an empirical study focusing on heart-rate variability measurement, the discussion underlines that a distanced theorizing of personal analytics is not sufficient if one wants to capture affective encounters between humans and their data doubles. Research outcomes suggest that these explanations can produce permanence and stability while also profoundly changing ways in which people reflect on themselves, on others and on their daily lives.

263 citations


"Personal Analytics Explorations to ..." refers background in this paper

  • ...Personal analytics (Ruckenstein, 2014; Wolfram, 2012) refers to a set of data-related practices that have been associated with the area of personal informatics (Li, Dey, Forlizzi, 2010) and the Quantified Self (Nafus & Sherman, 2014)....

    [...]

Journal Article
Dawn Nafus1, Jamie Sherman1
TL;DR: This ethnography of the Quantified Self movement, where participants collect extensive data about their own bodies, identifies practices that go beyond simply internalizing predetermined frameworks and enables participants to partially yet significantly escape the frames created by the biopolitics of the health technology industry.
Abstract: Big data is often seen in terms of powerful institutions managing the actions of populations through data. This ethnography of the Quantified Self movement, where participants collect extensive data about their own bodies, identifies practices that go beyond simply internalizing predetermined frameworks. The QS movement attracts the most hungrily panoptical of the data aggregation businesses in addition to people who have developed their own notions of analytics that are separate from, and in relation to, dominant practices of firms and institutionalized scientific production. Their practices constitute an important modality of resistance to dominant modes of living with data, an approach that we call “soft resistance.” Soft resistance happens when participants assume multiple roles as project designers, data collectors, and critical sense-makers who rapidly shift priorities. This constant shifting keeps data sets fragmented and thus creates material resistance to traditional modes of data aggregation. It also breaks the categories that make traditional aggregations appear authoritative. This enables participants to partially yet significantly escape the frames created by the biopolitics of the health technology industry.

224 citations


"Personal Analytics Explorations to ..." refers background in this paper

  • ...The first case comes from an effort to emulate the existing hobbyist learning structure that exists in the broader Quantified Self sociotechnical movement....

    [...]

  • ...Power users who identify with the Quantified Self movement (also known as QSelf-ers or QSers) regularly convene in major urban areas to share personal analytics projects that they have pursued and how that helped them to gain new insight and learn about themselves (Choe, Lee, Lee, Pratt, & Kientz, 2014; Lee, 2014)....

    [...]

  • ...Quantified Self: A sociotechnical movement referring to the practices of persistent recording and tracking of information in a quantified format for subsequent examination, reflection, and analysis....

    [...]

  • ...Many who have documented self-tracking and personal analytics practices identify 2007 as the year in which a community and sociotechnical movement (the “Quantified Self”) emerged in the Silicon Valley, with Wired magazine editors Kevin Kelly and Gary Wolf being attributed as primary initiators (Choe et al., 2014; Lee, 2014)....

    [...]

  • ...At the same time, each of the other girls found, with some assistance from research team members, one or two data plots that they felt offered the most for them to talk about and took turns projecting their data display in front of the group and sharing what they believe they had discovered, similar to what takes place in a hobbyist Quantified Self group....

    [...]

Journal ArticleDOI
TL;DR: In this paper, the authors outline the history of how students' creative production has been used to meet the goals of media educators and highlight new trends in media education that are instructive for creative production.
Abstract: Based on work in media studies, new literacy studies, applied linguistics, the arts and empirical research on the experiences of urban youths' informal media arts practices we articulate a new vision for media education in the digital age that encompasses new genres, convergence, media mixes, and participation. We first outline the history of how students' creative production has been used to meet the goals of media educators and highlight new trends in media education that are instructive for creative production. Our goal is to introduce and situate the new ways in which youth are participating in creative production and the subsequent impact that this might have on teaching and learning media education today. Findings from an ethnographic study are used to demonstrate the potential of youth producing new media, such as videogames and interactive art, on media education research and practice.

207 citations


"Personal Analytics Explorations to ..." refers background in this paper

  • ...…Walkington, Petrosino, & Sherman, 2013) or how personalization can also be achieved and supported by providing youth with generative and expressive computational media where they can design and engineer artifacts that are specific to their own interests and prior expertise (Peppler & Kafai, 2007)....

    [...]

Frequently Asked Questions (6)
Q1. What are the contributions mentioned in the paper "Digital technologies and instructional design for personalized learning" ?

Personal Analytics Explorations to Support Youth Learning this paper has been a hot topic in the field of personal analytics. 

In looking toward the future, learning activities for individual novices and youth doing personal analytics work should incorporate supports to help students notice patterns and understand more about the phenomenon that they are quantifying through their projects. Still, they were able to use those records in productive ways, suggesting that while personal analytics is gaining in prominence because of increased availability of individual tracking devices, those are not absolutely essential for this sort of instructional approach to work. Thus, the prospects for personal analytics learning explorations to become an option for those who want to support personalized learning are promising. 

The most commonly used data visualization software in their studies was TinkerPlots, a novice-friendly data visualization tool developed to enable elementary students and above to use drag and drop interactions to produce dynamic data visualizations (Konold & Miller, 2005). 

While each student had a wearable device that would track their steps and the students examined data from those throughout the larger unit, the specific activity discussed here involved analytics on manually collected data. 

There are questions that remain for us as a field to examine, such as what conditions promote an initial desire from students to look at their own data, how to support learning with different software tools, and what kinds of social configurations around a personal analytics learning activity enables broader participation and deep inspection of data. 

It took another girl’s comment that even though those exceptions existed, there did appear to be some upward152Personal Analytics Explorations to Support Youth Learningtrend with the “Dragging” bin having much lower values for minutes of sleep and the “Pumped Up” bin having the second highest number minutes of sleep.