scispace - formally typeset
Search or ask a question
Book ChapterDOI

PLS visualization using biplots: an application to team effectiveness

01 Jul 2020-Vol. 12251, pp 214-230
TL;DR: Based on a factorization provided by the Partial Least Square (PLS) methodology, the construction of a biplot for both exploratory and predictive purposes was shown to visually identify patterns among response and explanatory variables in the same graph.
Abstract: Based on a factorization provided by the Partial Least Square (PLS) methodology, the construction of a biplot for both exploratory and predictive purposes was shown to visually identify patterns among response and explanatory variables in the same graph. An application on a team effectiveness research, collected from 82 teams from 57 Portuguese companies and their respective leaders, containing two effectiveness criteria (team performance and the quality of the group experience as response variables), was considered and interpretation of the biplot was analyzed in detail. Team effectiveness was considered as the result of the role played by thirteen variables: team trust (two dimensions), team psychological capital (four dimensions), collective behavior, transformational leadership, intragroup conflict (two dimensions), team psychological safety, and team cohesion (two dimensions). Results revealed that the biplot approach proposed was able to capture the most critical variables for the model and correctly assigned the signals and the strength of the regression coefficients. Regarding the response variable team performance, the most significant variables to the model were team efficacy, team optimism, and team psychological safety. Concerning the response variable quality of the group experience, intragroup conflict, team-trust, and team cohesion emerged as the most relevant predictors. Overall, the results found are convergent with the literature on team effectiveness.

Summary (3 min read)

1 Introduction

  • Frequently, multivariate data analysis seeks to perceive the existing underlying structure and to understand the relationships established within data.
  • Likewise, a graph of the results of a specific statistical method, e.g., the Principal Component Analysis (PCA) biplot, enhances data familiarity.
  • This is the case of an ill-posed problem, in which the predictors are many and quasi-collinear, leading to an unstable Ordinary Least Squares (OLS) solution, i.e., the OLS estimates have high variance (Belsley, Kuh & Welsch, 2004).
  • Based on the outputs of the PLS (scores, loadings, and weights vectors), the variances and correlations of the variables can be revealed by employing an exploratory PLS biplot.
  • The primary purpose of this article is to provide a straightforward interpretation for the PLS biplot applicable to both exploratory and predictive purposes, illustrating its application in team effectiveness research data.

2.1 Partial Least Squares

  • One might use the PLS to estimate the regression coefficients.
  • The PLS model consists of three other models, two external and one internal, as a result of the application of a suitable algorithm, usually the Nonlinear Iterative Partial Least Squares .
  • The method seeks to estimate some underlying factors that decompose X and Y simultaneously, maximizing the covariance between them, establishing the socalled outer relations for X and Y individually (Geladi & Kowalsky, 1986).
  • Considering the extraction of all possible factors, the PLS decomposition results in X = TP' and Y = UQ', where T contains the scores of the predictors’ matrix, P holds the loadings of X.

2.4 The Exploratory PLS Biplot

  • The symbol ∝ means ‘to normalize the result of the operation’.
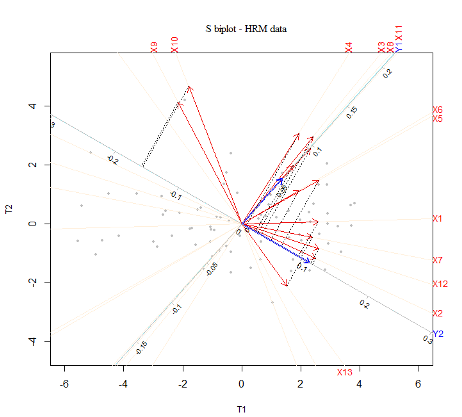
  • Considering each set of biplot vectors separately (predictors and responses), the angle formed by two vectors provides an approximation for the sample correlation coefficient related to the associated variables (Grafelman, 2012).
  • Therefore, if ∠(𝐩i ′, 𝐩j ′) ≅ 0°, it means that the associated variables are strongly correlated because the cosine of the angle between the biplot vectors is close to one.
  • The accuracy of this approximation will depend on how much the variables contribute to each of the underlying components estimated (Bassani, Ambrogi, Coradini, & Biganzoli, 2010), as well as the biplot explained variance (Greenacre, 2012).

2.5 The Predictive PLS Biplot

  • In the predictive PLS biplot, the rows of the matrix R denote the biplot points instead of the rows of T. Further, the columns of Q' symbolize the responses through biplot vectors.
  • Each response can also define a calibrated axis, on which one can project the set of points (𝐫i ′) to get an approximation of the coefficients.
  • Therefore, there are two ways to evaluate an approximation for these estimates in the biplot visually.
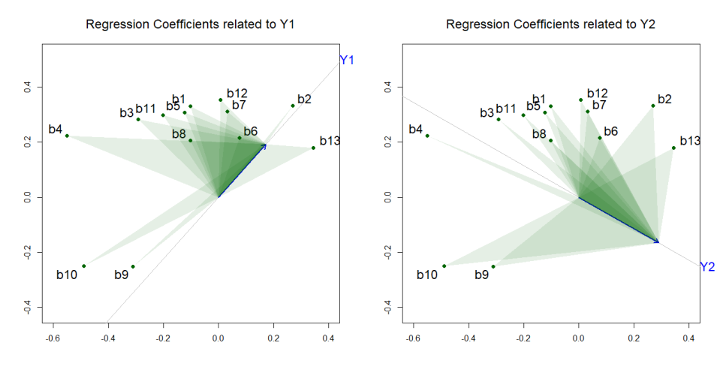
  • The area and position of the triangles furnish other relevant information about the PLS regression coefficients, such as the signal and the importance of each predictor to the model.

3 Application

  • Teams of individuals working together to achieve a common goal are a central part of daily life in modern organizations (Mathieu, Tannenbaum, Donsbach, & Alliger, 2014).
  • By bringing together individuals with different skills and knowledge, teams emerge as a competitive asset in the ever-changing organizational environment.
  • When teams are created, the ultimate goal is to generate value for the organization.
  • Accordingly, studying team effectiveness and the conditions that enable the team to be effective has been a central concern for both research and practice (Kozlowski & Ilgen, 2006).

3.1 Variables

  • In the present research, in line with previous studies (e.g., Hackman, 1987), the authors consider team effectiveness as a multidimensional construct.
  • Team effectiveness will be considered, in the present study, as the result of the role played by thirteen variables: team trust (2 dimensions), team psychological capital (4 dimensions), collective behavior, transformational leadership, intragroup conflict (2 dimensions), team psychological safety, and team cohesion (2 dimensions).
  • Transformational leadership (X8) can be defined as a leadership style that encourages followers to do more than they originally expected, broadening and changing their interests and leading to conscientiousness and acceptance of the team’s purposes (Bass, 1990).
  • It is a confidence climate that comes from mutual respect and trust between members (Edmondson, 1999).
  • Task cohesion (X12) refers to the shared commitment among members towards achieving a goal that requires the collective efforts of the group.

3.2 Sample and Data Collection Procedure

  • Organizations were selected by convenience, using the personal and professional contacts network of the research team.
  • Data was obtained from 104 teams and their respective leaders.
  • Missing values in the questionnaires were replaced by the item average (in case of a random distribution) or by expectation-maximization (EM) method (in case of a non-random distribution).

3.3 Measures

  • Apart from team performance that was assessed by team leaders, all variables were measured by team members.
  • Team trust and team psycap were assessed using 6-point scales, intragroup conflict and team psychological safety were evaluated on 7-point scales and the remaining variables were measured on 5-point scales.

3.4 PLS Biplot Results

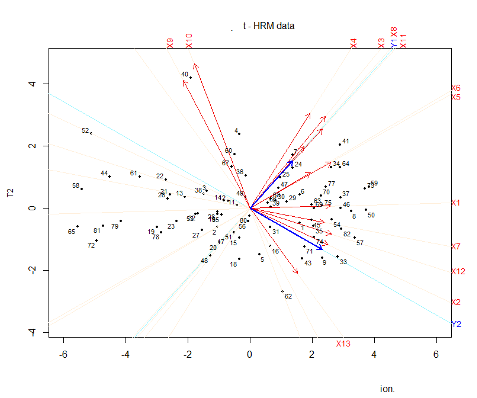
  • In order to reveal a linear relation between the variables describing team effectiveness and the explanatory variables, the PLS was used to construct the external and internal models.
  • Table 2 shows some significantly correlated variables evidenced by the biplot (X2 and X12, X7 and X12, X3 and X11, and X9 and X10), a pair of variables that displayed negative correlation (X2 and X9), and others that manifested a weak correlation visually (X5 and X13, X6 and X13), all of them flanked by the exact sample correlation coefficients.
  • For comparison purposes only, Fig. 2 shows the results of the area biplot method.
  • On the negative side, the predictors Task conflict (X9) and Affective conflict (X10) are the most influential in the model, while the explanatory variables Team trust-task (X2), Task cohesion (X12), and Social cohesion (X13) have the most significant and positive impact concerning Y2.

4 Discussion and Conclusions

  • Regarding the application of the method the authors use in this work, the results point to the “validity” of such an application concerning the relationships found between the group processes and the team output variables considered.
  • These results are in line with the literature.
  • Task cohesion tends to be positively associated with team outcomes, but social cohesion can have a more complex relationship with team outcomes due the fact that social cohesion, although it increases the willingness to help each other and to cooperate, can also lead to uncritical acceptance of solutions and to groupthink (Janis, 1972).
  • Overall, the studies tend to suggest that, in certain circumstances, task conflict may be positively related to group outcomes (e.g., De Wit et al., 2012) emphasizing the role of moderators, such as the conflict-handling strategies used in the team.

Did you find this useful? Give us your feedback

Content maybe subject to copyright    Report

This is a post-peer-review, pre-copyedit version of an article published in O. Gervasi et al.
(Eds.) Computational Science and Its Applications ICCSA 2020. Lecture Notes in
Computer Science. The final authenticated version is available online at:
https://doi.org/10.1007/978-3-030-58808-3_17
PLS Visualization Using Biplots: An Application to
Team Effectiveness
Alberto Silva
1,2 [0000-0002-3496-6802]
, Isabel Dórdio Dimas
3,4 [0000-0003-4481-2644]
, Paulo Renato Lourenço
3,5 [0000-
0003-1405-3835]
, Teresa Rebelo
3,5 [0000-0003-3380-0840]
, Adelaide Freitas
1,2 [0000-0002-4685-1615]
1
Departament of Mathematics, University of Aveiro, 3810-193 Aveiro, Portugal
2
CIDMA, Center for Research & Development in Mathematics and Applications, University of Aveiro, 3810-193
Aveiro, Portugal
3
CeBER, Centre for Business and Economics Research, University of Coimbra, 3004-512 Coimbra, Portugal
4
FEUC, University of Coimbra, 3004-512 Coimbra, Portugal
5
FPCEUC, University of Coimbra, 3000-115 Coimbra, Portugal
albertos@ua.pt, idimas@fe.uc.pt, prenato@fpce.uc.pt, terebelo@fpce.uc.pt,
adelaide@ua.pt
Abstract.
Based on a factorization provided by the Partial Least Square (PLS) methodo-logy, the construction of a biplot for both
exploratory and predictive purposes was shown to visually identify patterns among response and explanatory variables
in the same graph. An application on a team effectiveness research, collected from 82 teams from 57 Portuguese
companies and their respective leaders, containing two effectiveness criteria (team performance and the quality of the
group experience as response variables), was considered and interpretation of the biplot was analyzed in detail. Team
effectiveness was considered as the result of the role played by thirteen variables: team trust (two dimensions), team
psychological capital (four dimensions), collective behavior, transformational leadership, intragroup conflict (two
dimensions), team psychological safety, and team cohesion (two dimensions). Results revealed that the biplot approach
proposed was able to capture the most critical variables for the model and correctly assigned the signals and the strength
of the regression coefficients. Regarding the response variable team performance, the most significant variables to the
model were team efficacy, team optimism, and team psychological safety. Concerning the response variable quality of
the group experience, intragroup conflict, team-trust, and team cohesion emerged as the most relevant predictors.
Overall, the results found are convergent with the literature on team effectiveness.
Keywords: Partial Least Square, Biplot, Organizational Teams, Team Effectiveness
1 Introduction
Frequently, multivariate data analysis seeks to perceive the existing underlying structure and to understand
the relationships established within data. Visual information via graphic displays can be a useful tool to
explore the dataset since it summarizes the data more directly and improves its understanding (Koch, 2014).
Likewise, a graph of the results of a specific statistical method, e.g., the Principal Component Analysis
(PCA) biplot, enhances data familiarity. The biplot method permits visual evaluation of the structure of
large data matrices through the approximation of a high-rank matrix by one of rank two. The PCA biplot
represents observations with points and variables with arrows. Small distances between units can indicate
the existence of clusters, while the size of an arrow depicts the standard deviation of the associated variable.
Further, the angle between two vectors approximates the linear correlation of the related variables (Gabriel,
1971).

When it comes to multivariate regression problems, sometimes one must fix some problems before
applying any methodology to estimate parameters and thinking about the graphical representation of its
results. This is the case of an ill-posed problem, in which the predictors are many and quasi-collinear,
leading to an unstable Ordinary Least Squares (OLS) solution, i.e., the OLS estimates have high variance
(Belsley, Kuh & Welsch, 2004). Under this condition, the Partial Least Squares (PLS) regression gives
better results, since it eliminates the quasi-collinearity issue. The PLS method extracts factors that maximize
the covariance between the predictors and response variables, and then regresses the response on these
latent factors. Based on the outputs of the PLS (scores, loadings, and weights vectors), the variances and
correlations of the variables can be revealed by employing an exploratory PLS biplot. On the other hand,
the PLS biplot can be adapted to provide a visual approximation of the PLS coefficient estimates, hence
the reason for naming it predictive PLS biplot.
The primary purpose of this article is to provide a straightforward interpretation for the PLS biplot
applicable to both exploratory and predictive purposes, illustrating its application in team effectiveness
research data. Interest in understanding complex relationships between variables of team effectiveness
datasets has been growing in recent years (Mathieu, Gallagher, Domingo, & Klock, 2019; Ringle, Sarstedt,
Mitchell, & Gudergan) and the PLS biplot method can play a crucial role in the analysis of this kind of data.
In order to achieve the main aim of the present work, the paper is structured in the following sections:
section 2 gives a brief overview of how PLS works, describing mathematical details; section 3 presents an
application of these methods on a subset of variables of real work teams, exploring the relationships
between a set of team effectiveness predictors (team trust, team psychological capital, collective behavior,
transformational leadership, intragroup conflict, team psychological safety and team cohesion) and two
team effectiveness criteria (team performance and quality of group experience). All the statistical analysis
was executed using R software; finally, section 4 includes the discussion of the results found, as well as
conclusions and future perspectives.
2 Methods
2.1 Partial Least Squares
Assume a multivariate regression model Y = X + E, in which Y is an (n × q) response matrix and X is a
(n × m) predictor matrix, and both are column centered, with m and q being respectively the number of
predictors and response variables, and n the number of observations. Also, is a (m × q) coefficients matrix,
and E is a (n × q) error matrix, such that m > n or the m explanatory variables are highly correlated. In this
case, one might use the PLS to estimate the regression coefficients. The PLS model consists of three other
models, two external and one internal, as a result of the application of a suitable algorithm, usually the
Nonlinear Iterative Partial Least Squares (NIPALS). The method seeks to estimate some underlying factors
that decompose X and Y simultaneously, maximizing the covariance between them, establishing the so-
called outer relations for X and Y individually (Geladi & Kowalsky, 1986). Considering the extraction of
all possible factors, the PLS decomposition results in
X TP' and Y UQ',
where T contains the scores of the predictors’ matrix, P holds the loadings of X. In turn, U and Q are the
matrices of scores and loadings relative to the response matrix Y. Additionally, an inner relation links the
X-scores and Y-scores matrices as follows:
,
where

󰆒
󰆒
are the regression coefficients for a given factor. In order to ensure maximum covariance between Y and X
when extracting PLS components, it is necessary to find two sets of weights w and q, which allow the
vectors t = Xw and u = Yq to be obtained. It can be done making t’u maximum and solving the optimization
problem


󰇝
󰆒
󰆒

󰇞
,
subject to: COR (
󰇜, ;

󰆒
.
2.2 Partial Least Squares Regression
Concisely, the NIPALS algorithm
1
performs the following steps (Abdi, 2010):
- Step 1. w X'u (X-weights).
- Step 2. t Xw (X-factor scores).
- Step 3. q Y't (Y-weights).
- Step 4. u = Yq (Y-scores).
At the i-th iteration of the algorithm, the PLS method estimates a single column
of the matrix T as a
linear combination of the variables X with coefficients w. This vector of weights w will compose the i-th
column of the matrix of weights W. Since in each iteration the matrix X is deflated, the columns of W are
non-comparable and, hence, T XW. In contrast, there exists a matrix 󰇛󰇜

which allows direct
computation of T by doing T = XR (Wold et al., 2004).
The estimated PLS regression equation is:

, where
󰇛
󰆒
󰇜

󰆒

Moreover,

and, thus,


󰇛
󰆒
󰇜

󰆒

󰆒

󰆒
. Notice that 
󰆒
is the Y-
weights matrix composed of the q vectors estimated in Step 3 of the NIPALS algorithm. Lastly, we can
write the predictive model as


where


󰆒
2.3 The Biplot
The term biplot was introduced by Gabriel (1971) and consists of a graphical representation that reveals
important characteristics of data structure, e.g., patterns of correlations between variables or similarities
between the observations (Greenacre, 2010). To achieve this, it uses the decomposition of a (n × m) target
matrix D into the product of two matrices, such that D = GH'. The dimension of the G matrix is (n × k),
and the size of H matrix is (m × k). Therefore, each element

of the matrix D can be written as the scalar
product of the i-th row of the left matrix G and the j-th column of the right matrix H', as follows:

󰆒
󰆒
󰆒
󰇛
󰇜
󰆒
󰆒
󰆒
󰆒

The matrices G and H that arise from the decomposition of D create two sets of points. If these points are
two-dimensional (i.e., k = 2), then the rows and columns of D can be represented employing a two-
dimensional graph, with the n rows of G represented by points, and the m columns of H' reproduced in the
form of vectors connected to the origin. In the graph, projecting
󰆒
onto the axis determined by
and then
multiplying the norm of that projection by the norm of
, the result will be equivalent to the geometric
definition of the scalar product, which can also be used to represent the element

of the target matrix D,
that is:

󰆒



where θ is the angle formed by the vectors
and
. Furthermore, each set of coordinates formed by a row
of G (i.e.,
󰆒
) is represented as a biplot point, and each column of the transpose of H (i.e.,
) is plotted as
a biplot vector.
2.4 The Exploratory PLS Biplot
Given a rank r data matrix, the PLS allows another matrix to be obtained with rank s that is an
approximation of the former, in which s < r. The PLS dataset is composed of two centered matrices X and
Y, wherein the matrix of predictors X has the dimension (n × m), and the matrix of responses Y has the size
1
In this context, the symbol means ‘to normalize the result of the operation’.

(n × q). Representing a target matrix D as a juxtaposition of X and Y, then it will be (n × (m + q)) and
denoted as D = [X Y]. Considering that the number of PLS components extracted is lower than the rank of
X, i.e., k < r, thus the matrix product TP' provides an approximation of X. Similarly, the matrix product
TQ' gives an approximation for Y, instead of UQ' (Oyedele & Lubbe, 2015). As a consequence,
provides
an approximation for D such that



󰇟

󰆒

󰆒
󰇠
󰇟󰇠
󰆒
Extracting just two components, the dimension of T is (n × 2) and the size of the block matrix [P Q]' is
(2 × (m + q)). So, the rows of T represent the biplot points in the exploratory PLS biplot, expressing the
observations of the sample, while the columns of the block matrix [P Q]' indicate the biplot vectors and
denote the variables, wherein those from column 1 to m refer to the predictors and from column (m + 1) to
(m + q) are associated with the responses. Considering each set of biplot vectors separately (predictors and
responses), the angle formed by two vectors provides an approximation for the sample correlation
coefficient related to the associated variables (Grafelman, 2012). Therefore, if 
󰆒
󰆒
 it means that
the associated variables are strongly correlated because the cosine of the angle between the biplot vectors
is close to one. On the other hand, when 
󰆒
󰆒
 and the biplot vectors point to almost opposite
directions, then it indicates a negative but substantial correlation. Lastly, a right angle suggests a weak
correlation between the related variables. However, the accuracy of this approximation will depend on how
much the variables contribute to each of the underlying components estimated (Bassani, Ambrogi, Coradini,
& Biganzoli, 2010), as well as the biplot explained variance (Greenacre, 2012).
2.5 The Predictive PLS Biplot
As previously seen in Section 2.2, the (m × q) matrix


󰆒
contains the PLS coefficient estimates,
in which the R columns are the transformed PLS X-weights, and Q is the matrix of Y-weights. In the
predictive PLS biplot, the rows of the matrix R denote the biplot points instead of the rows of T. Further,
the columns of Q' symbolize the responses through biplot vectors. Each response can also define a
calibrated axis, on which one can project the set of points (
󰆒
) to get an approximation of the coefficients.
Considering a specific response
and a fixed predictor
, each element of the matrix

is computed
as


󰆒




.
Therefore, there are two ways to evaluate an approximation for these estimates in the biplot visually. The
first manner consists of the calibration of biplot axes (Greenacre, 2010; Oyedele & Lubbe, 2015) and
mentally reading the projection of the biplot point on the biplot axis. In the second mode, the area biplot
method is applied (Gower et al., 2010; Oyedele & Lubbe, 2015), in which the approximation of


is
obtained from the area determined by the origin, the rotated biplot point
󰆒
, and the endpoint of
. The area
and position of the triangles furnish other relevant information about the PLS regression coefficients, such
as the signal and the importance of each predictor to the model.
3 Application
Teams of individuals working together to achieve a common goal are a central part of daily life in modern
organizations (Mathieu, Tannenbaum, Donsbach, & Alliger, 2014). By bringing together individuals with
different skills and knowledge, teams emerge as a competitive asset in the ever-changing organizational
environment. When teams are created, the ultimate goal is to generate value for the organization.
Accordingly, studying team effectiveness and the conditions that enable the team to be effective has been
a central concern for both research and practice (Kozlowski & Ilgen, 2006).
3.1 Variables
In the present research, in line with previous studies (e.g., Hackman, 1987), we consider team effectiveness
as a multidimensional construct. Thus, in this study, team effectiveness is evaluated through two criteria:
team performance and the quality of group experience. Team performance (
) refers to the extent to which
team outcomes respect the standards set by the organization, in terms of quantity, quality, delivery time and

costs (Rousseau & Aubé, 2010). The quality of the group experience (
) is related to the quality of the
social climate within the team (Aubé & Rousseau, 2005).
Team effectiveness will be considered, in the present study, as the result of the role played by thirteen
variables: team trust (2 dimensions), team psychological capital (4 dimensions), collective behavior,
transformational leadership, intragroup conflict (2 dimensions), team psychological safety, and team
cohesion (2 dimensions). Each variable will be briefly described as follows.
Team trust refers to the aggregate levels of trust that team members have in their fellow teammates
(Langfred, 2004) and has been conceptualized as a bidimensional construct: the affective dimension of team
trust (
) is related to the perception of the presence of shared ideas, feelings, and concerns within the team;
the task dimension of team trust (
) has been associated with the recognition by team members of the
levels of professionalism and competence of their teammates and on their ability to appropriately perform
the tasks (McAllister, 1995).
Team psychological capital (PsyCap) can be defined as a team positive psychological state characterized
by: having confidence (efficacy) to succeed in challenging tasks; making a positive attribution (optimism)
about succeeding now and in the future; persevering, and when necessary, redirecting paths to goals (hope)
in order to be effective; and having the ability to bounce back from challenges and setbacks (resilience)
(Luthans, Avolio, Avey, & Norman., 2007; Luthans & Youssef-Morgan, 2017; Walumbwa Luthans, Avey,
& Oke, 2011). In summary, team PsyCap includes four team psychological resources: team efficacy (
),
team optimism (
), team hope (
), and team resilience (
).
Collective behavior (
) refers to the members’ tendency to coordinate, evaluate, and utilize task inputs
from other team members when performing a group task (Driskell, Salas, & Hughes, 2010).
Transformational leadership (
) can be defined as a leadership style that encourages followers to do
more than they originally expected, broadening and changing their interests and leading to
conscientiousness and acceptance of the team’s purposes (Bass, 1990). Carless, Wearing and Mann (2000)
described transformational leaders as those who exhibit the following seven behaviors: they 1)
communicate a vision; 2) develop staff; 3) provide support for them to work towards their objectives
through coordinated team work; 4) empower staff; 5) are innovative by using non-conventional strategies
to achieve their goals; 6) lead by example; 7) are charismatic.
Intragroup conflict can be defined as a disagreement that is perceived as creating tension at least by one
of the parties involved in an interaction (De Dreu & Weingart, 2003). Conflicts in teams may emerge as a
result of the presence of different ideas about the tasks performed (
) task conflict or may be related
to differences between team members in terms of values or personalities (

) affective conflict (Jehn,
1994).
Team psychological safety (

) relates to team members’ perceptions about what the consequences will
be of taking interpersonal risks at the work environment. It means taking beliefs for granted about how
others will react when one speaks up or participates. It is a confidence climate that comes from mutual
respect and trust between members (Edmondson, 1999).
Team cohesion can be defined as the team members’ inclination to create social bonds, resulting in the
group sticking together, remaining united, and wanting to work together (Carron 1982; Salas, Grossman,
Hughes, & Coultas, 2015). It can be related to the task or the affective system of the team. Task cohesion
(

) refers to the shared commitment among members towards achieving a goal that requires the collective
efforts of the group. Social cohesion (

) refers to shared liking or attraction to the group and to the nature
and quality of the emotional bonds of friendship, liking, caring, and closeness among group members
(Chang & Bordia, 2001).
3.2 Sample and Data Collection Procedure
Organizations were selected by convenience, using the personal and professional contacts network of the
research team. To collect data, key stakeholders in each organization (CEOs or human resources managers)
were contacted to explain the purpose and requirements of the study. When the organization agreed to
participate, the selection of teams for the survey was based on the following criteria (Cohen & Bailey,
1997): teams must be composed of at least three members; should be perceived by themselves and others
as a team; they have to regularly interact, interdependently, to accomplish a common goal; and they must
have a formal supervisor who is responsible for the actions of the team.
Data was collected following two strategies. In most organizations, questionnaires were filled in during
team meetings, in the presence of a member of the research team. When it was not possible to implement
this strategy, they were filled in online via an electronic platform. Data was obtained from 104 teams and
their respective leaders. After eliminating from the sample teams with a team members’ response rate below
50% and participants with more than 10% of missing values, the remaining sample had a total of 82 teams.
In this remaining sample, missing values in the questionnaires were replaced by the item average (in case

Citations
More filters
Journal ArticleDOI
01 May 1981
TL;DR: This chapter discusses Detecting Influential Observations and Outliers, a method for assessing Collinearity, and its applications in medicine and science.
Abstract: 1. Introduction and Overview. 2. Detecting Influential Observations and Outliers. 3. Detecting and Assessing Collinearity. 4. Applications and Remedies. 5. Research Issues and Directions for Extensions. Bibliography. Author Index. Subject Index.

4,948 citations

01 Jan 2016
TL;DR: In this paper, the authors present a psychological study of groupthink in foreign policy decisions and fiascoes, which they call "Victims of Groupthink" and "Fiascoes".
Abstract: Thank you for reading victims of groupthink a psychological study of foreign policy decisions and fiascoes. As you may know, people have look hundreds times for their chosen readings like this victims of groupthink a psychological study of foreign policy decisions and fiascoes, but end up in malicious downloads. Rather than reading a good book with a cup of tea in the afternoon, instead they are facing with some malicious bugs inside their computer.

389 citations

References
More filters
Journal ArticleDOI
TL;DR: An integrative theoretical framework to explain and to predict psychological changes achieved by different modes of treatment is presented and findings are reported from microanalyses of enactive, vicarious, and emotive mode of treatment that support the hypothesized relationship between perceived self-efficacy and behavioral changes.
Abstract: The present article presents an integrative theoretical framework to explain and to predict psychological changes achieved by different modes of treatment. This theory states that psychological procedures, whatever their form, alter the level and strength of self-efficacy. It is hypothesized that expectations of personal efficacy determine whether coping behavior will be initiated, how much effort will be expended, and how long it will be sustained in the face of obstacles and aversive experiences. Persistence in activities that are subjectively threatening but in fact relatively safe produces, through experiences of mastery, further enhancement of self-efficacy and corresponding reductions in defensive behavior. In the proposed model, expectations of personal efficacy are derived from four principal sources of information: performance accomplishments, vicarious experience, verbal persuasion, and physiological states. The more dependable the experiential sources, the greater are the changes in perceived selfefficacy. A number of factors are identified as influencing the cognitive processing of efficacy information arising from enactive, vicarious, exhortative, and emotive sources. The differential power of diverse therapeutic procedures is analyzed in terms of the postulated cognitive mechanism of operation. Findings are reported from microanalyses of enactive, vicarious, and emotive modes of treatment that support the hypothesized relationship between perceived self-efficacy and behavioral changes. Possible directions for further research are discussed.

38,007 citations


"PLS visualization using biplots: an..." refers background in this paper

  • ...…research suggests that when team members have a collective belief in their ability to be effective, they explore and share knowledge and are more prepared to implement new ways of achieving results, because they believe these behaviors will lead to higher levels of performance (Bandura 1977)....

    [...]

  • ...Additionally, previous research suggests that when team members have a collective belief in their ability to be effective, they explore and share knowledge and are more prepared to implement new ways of achieving results, because they believe these behaviors will lead to higher levels of performance (Bandura 1977)....

    [...]

Journal ArticleDOI
TL;DR: In this paper, the authors introduce the construct of team psychological safety, a shared belief held by members of a team that the team is safe for interpersonal risk taking, and test it in a multimethod field study.
Abstract: This paper presents a model of team learning and tests it in a multimethod field study. It introduces the construct of team psychological safety—a shared belief held by members of a team that the team is safe for interpersonal risk taking—and models the effects of team psychological safety and team efficacy together on learning and performance in organizational work teams. Results of a study of 51 work teams in a manufacturing company, measuring antecedent, process, and outcome variables, show that team psychological safety is associated with learning behavior, but team efficacy is not, when controlling for team psychological safety. As predicted, learning behavior mediates between team psychological safety and team performance. The results support an integrative perspective in which both team structures, such as context support and team leader coaching, and shared beliefs shape team outcomes.

6,953 citations


"PLS visualization using biplots: an..." refers background in this paper

  • ...Regarding the relationship between team psychological safety and team performance, previous studies suggest that team performance can be facilitated, directly or indirectly, by the presence of a psychological security climate (e.g., Edmondson 1999)....

    [...]

  • ...It is a confidence climate that comes from mutual respect and trust between members (Edmondson 1999)....

    [...]

Journal ArticleDOI
TL;DR: In this paper, the authors addressed the nature and functioning of relationships of interpersonal trust among managers and professionals in organizations, the factors influencing trust's development, and the implications of trust for behavior and performance.
Abstract: This study addressed the nature and functioning of relationships of interpersonal trust among managers and professionals in organizations, the factors influencing trust's development, and the implications of trust for behavior and performance Theoretical foundations were drawn from the sociological literature on trust and the social-psychological literature on trust in close relationships An initial test of the proposed theoretical framework was conducted in a field setting with 194 managers and professionals

6,473 citations

Book
08 Jul 1980
TL;DR: In this article, the authors present a method for detecting and assessing Collinearity of observations and outliers in the context of extensions to the Wikipedia corpus, based on the concept of Influential Observations.
Abstract: 1. Introduction and Overview. 2. Detecting Influential Observations and Outliers. 3. Detecting and Assessing Collinearity. 4. Applications and Remedies. 5. Research Issues and Directions for Extensions. Bibliography. Author Index. Subject Index.

6,449 citations

Journal ArticleDOI
TL;DR: In this paper, a tutorial on the Partial Least Squares (PLS) regression method is provided, and an algorithm for a predictive PLS and some practical hints for its use are given.

6,393 citations

Frequently Asked Questions (1)
Q1. What contributions have the authors mentioned in the paper "Pls visualization using biplots: an application to team effectiveness" ?

In this paper, the authors used the Partial Least Squares ( PLS ) method to identify patterns among response and explanatory variables in the same graph.