scispace - formally typeset
Search or ask a question
Journal ArticleDOI

Preliminary study on the use of near infrared hyperspectral imaging for quantitation and localisation of total glucosinolates in freeze-dried broccoli

TL;DR: In this article, the use of hyperspectral imaging to quantify and localise total glucosinolates in florets of a single broccoli species has been examined Two different spectral regions (vis-NIR and NIR), a number of spectral pre-treatments and different mask development strategies were studied to develop the quantitative models.
About: This article is published in Journal of Food Engineering.The article was published on 2014-04-01 and is currently open access. It has received 28 citations till now. The article focuses on the topics: Hyperspectral imaging.

Summary (2 min read)

1. Introduction

  • The aim of this study was to evaluate the potential of hyperspectral imaging technology for the quantitative screening and localisation of total glucosinolates in freeze-dried broccoli.
  • Since predictive models developed on freeze-dried powders by conventional NIR spectrometers may not be transferred directly to hyperspectral imaging datasets, a new predictive model must be generated using an actual hyperspectral imaging system on homogeneous, freeze-dried broccoli powders after which it may be applied to hyperspectral images of intact broccoli for localisation and quantitation of total glucosinolates.
  • To their knowledge, this is the first time that this analytical tool has been applied to broccoli for these purposes.

2.2. Hyperspectral imaging analysis

  • Data were recorded in units of reflectance and saved in ENVI header format using the instrument acquisition software (Spectral Scanner; DV Optics, Padua, Italy).
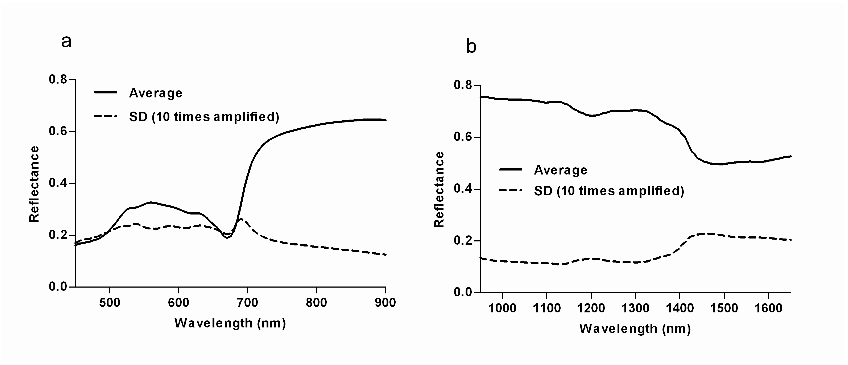
  • When using System 1, only spectral data in the 450 -900 nm regions were used in data analysis due to reduced efficiency of the light source and CCD in wavelength regions outside this range.
  • In the case of System 2, the spectral range was attenuated to 950 -1650 nm for similar operational reasons.

2.3. Data processing and analysis

  • Data treatment and quantitative model development was carried out using Matlab (R2010b; The Math Works, Inc. USA).
  • For each hyperspectral image, regions of interest (ROIs) of approx.
  • 3 cm diameter were selected using an interactive selection tool available in the acquisition software ('ROI tool') and 500 pixels were randomly-selected within each ROI.
  • Spectral data were pre-treated using the standard normal variate (SNV) transform to diminish the effects of light scatter.
  • Finally, quantitative calibrations were developed by partial least squares (PLS) regression using total glucosinolates as the dependent (Y) variable and pixel spectra as the independent (X) variables.

2.4 Prediction map

  • Slices of whole freeze-dried broccoli were scanned in the NIR zone (950-1650 nm) to apply the previously constructed model and identify the glucosinolate allocation.
  • Prior to the quantitative analysis, a thresholding rule method was applied to the broccoli images to isolate the broccoli from other parts of image.
  • An image was generated using the maximum reflectance value of each pixel spectrum in a raw image.
  • A threshold of 0.45 reflectance units was set analysing the corresponding histogram and drawing a tentative mask image in an iterative process.
  • SNV was applied to minimise the effects of scattering in the mask created and then the PLS model was applied.

3.2. Prediction map

  • Their potent odour and pronounced taste suggests a role in herbivore and microbial defence.
  • Deposition in external plant parts, confirmed spectroscopically in this work, would be the optimal location for these purposes.

4. Conclusion

  • Two different spectral regions (vis-NIR and NIR) were studied to develop the quantitative models.
  • Better results were obtained using the 950-1650 nm wavelength range and subsequent analyses were therefore carried out using this spectral zone.
  • The procedure demonstrates potential for the quantitative screening and location of total glucosinolates in broccoli using the 950-1650 nm wavelength range.
  • Nevertheless, a comprehensive study should be made in order to evaluate all other relevant sources of variability in the complete development of these models.
  • Such a study would entail several years work but the results reported herein suggest the viability of obtaining useful results from such an undertaking.

Did you find this useful? Give us your feedback

Citations
More filters
Journal ArticleDOI
TL;DR: This review aims to present a general perspective about near-infrared and mid- Infrared imaging/microspectroscopy in plant research to compare potentialities of these methodologies with their advantages and limitations.
Abstract: Plant cells, tissues and organs are composed of various biomolecules arranged as structurally diverse units, which represent heterogeneity at microscopic levels. Molecular knowledge about those constituents with their localization in such complexity is very crucial for both basic and applied plant sciences. In this context, infrared imaging techniques have advantages over conventional methods to investigate heterogeneous plant structures in providing quantitative and qualitative analyses with spatial distribution of the components. Thus, particularly, with the use of proper analytical approaches and sampling methods, these technologies offer significant information for the studies on plant classification, physiology, ecology, genetics, pathology and other related disciplines. This review aims to present a general perspective about near-infrared and mid-infrared imaging/microspectroscopy in plant research. It is addressed to compare potentialities of these methodologies with their advantages and limitations. With regard to the organization of the document, the first section will introduce the respective underlying principles followed by instrumentation, sampling techniques, sample preparations, measurement, and an overview of spectral pre-processing and multivariate analysis. The last section will review selected applications in the literature.

244 citations


Cites methods from "Preliminary study on the use of nea..."

  • ...Moreover, the quantification and localization of glucosinolates in florets of a single broccoli species were examined by hyperspectral imaging in the regions of 950–1650 nm [91]....

    [...]

Journal ArticleDOI
TL;DR: In this paper, detailed applications of hyperspectral imaging (HSI) system in various food processes are outlined, including cooking, drying, chilling, freezing and storage, and salt curing.
Abstract: Background The quality of products depends on their processing. Effective way of monitoring and controlling these processes will ensure the quality and safety of products. Since traditional measurement methods cannot achieve on-line monitoring, imaging spectroscopy, as a fast, accurate and non-destructive detection tool, has been widely used to evaluate quality and safety attributes of foods undergoing various processes. Scope and Approach In the current review, detailed applications of hyperspectral imaging (HSI) system in various food processes are outlined, including cooking, drying, chilling, freezing and storage, and salt curing. The study emphasized the ability of HSI technique to detect internal and external quality parameters in different food processes. Also, the advantages and disadvantages of HSI applications on these food processes are discussed. Key Findings and Conclusions The literature presented in this review clearly demonstrate that HSI has the ability to inspect and monitor different food manufacturing processes and has the potential to control the quality and safety of the processed foods. Although still with some barriers, it can be expected the HSI systems will find more useful and valuable applications in the future evaluation of food processes.

228 citations

Journal ArticleDOI
TL;DR: Recent advances and applications of Hyperspectral imaging in detecting, classifying, and visualizing quality and safety attributes of fruits and vegetables and the basic principles and major instrumental components are presented.
Abstract: Objective quality assessment and efficacious safety surveillance for agricultural and food products are inseparable from innovative techniques. Hyperspectral imaging (HSI), a rapid, nondestructive, and chemical-free method, is now emerging as a powerful analytical tool for product inspection by simultaneously offering spatial information and spectral signals from one object. This paper focuses on recent advances and applications of HSI in detecting, classifying, and visualizing quality and safety attributes of fruits and vegetables. First, the basic principles and major instrumental components of HSI are presented. Commonly used methods for image processing, spectral pretreatment, and modeling are summarized. More importantly, morphological calibrations that are essential for nonflat objects as well as feature wavebands extraction for model simplification are provided. Second, in spite of the physical and visual attributes (size, shape, weight, color, and surface defects), applications from the last decade are reviewed specifically categorized into textural characteristics inspection, biochemical components detection, and safety features assessment. Finally, technical challenges and future trends of HSI are discussed.

151 citations

Journal ArticleDOI
TL;DR: The results of this study show that the low-field NMR and MRI methods can precisely provide the quantitative information of water status inside food materials, and can be used to investigate the effects of food processing on product quality.

149 citations

Journal ArticleDOI
01 Aug 2016-Talanta
TL;DR: Results reveal that spectral imaging integrated with multivariate analysis has good potential for rapidly evaluating the purity of organic spelt flour.

50 citations

References
More filters
Book
30 Jul 2004
TL;DR: In this paper, the authors present a set of techniques for detecting anomalous infrared spectra, including Fourier Transform Infrared Spectrometers (FTIS) and Spectral Spectral Transform Transform (STT) this paper.
Abstract: Series Preface.Preface.Acronyms, Abbreviations and Symbols.About the Author.1. Introduction.1.1 Electromagnetic Radiation.1.2 Infrared Absorptions.1.3 Normal Modes of Vibration.1.4 Complicating Factors.1.4.1 Overtone and Combination Bands.1.4.2 Fermi Resonance.1.4.3 Coupling.1.4.4 Vibration-Rotation Bands.References.2. Experimental Methods.2.1 Introduction.2.2 Dispersive Infrared Spectrometers.2.3 Fourier-Transform Infrared Spectrometers.2.3.1 Michelson Interferometers.2.3.2 Sources and Detectors.2.3.3 Fourier-Transformation.2.3.4 Moving Mirrors.2.3.5 Signal-Averaging.2.3.6 Advantages.2.3.7 Computers.2.3.8 Spectra.2.4 Transmission Methods.2.4.1 Liquids and Solutions.2.4.2 Solids.2.4.3 Gases.2.4.4 Pathlength Calibration.2.5 Reflectance Methods.2.5.1 Attenuated Total Reflectance Spectroscopy.2.5.2 Specular Reflectance Spectroscopy.2.5.3 Diffuse Reflectance Spectroscopy.2.5.4 Photoacoustic Spectroscopy.2.6 Microsampling Methods.2.7 Chromatography-Infrared Spectroscopy.2.8 Thermal Analysis-Infrared Spectroscopy.2.9 Other Techniques.References.3. Spectral Analysis.3.1 Introduction.3.2 Group Frequencies.3.2.1 Mid-Infrared Region.3.2.2 Near-Infrared Region.3.2.3 Far-Infrared Region.3.3 Identification.3.4 Hydrogen Bonding.3.5 Spectrum Manipulation.3.5.1 Baseline Correction.3.5.2 Smoothing.3.5.3 Difference Spectra.3.5.4 Derivatives.3.5.5 Deconvolution.3.5.6 Curve-Fitting.3.6 Concentration.3.7 Simple Quantitative Analysis.3.7.1 Analysis of Liquid Samples.3.7.2 Analysis of Solid Samples.3.8 Multi-Component Analysis.3.9 Calibration Methods.References.4. Organic Molecules.4.1 Introduction.4.2 Aliphatic Hydrocarbons.4.3 Aromatic Compounds.4.4 Oxygen-Containing Compounds.4.4.1 Alcohols and Phenols.4.4.2 Ethers.4.4.3 Aldehydes and Ketones.4.4.4 Esters.4.4.5 Carboxylic Acids and Anhydrides.4.5 Nitrogen-Containing Compounds.4.5.1 Amines.4.5.2 Amides.4.6 Halogen-Containing Compounds.4.7 Heterocyclic Compounds.4.8 Boron Compounds.4.9 Silicon Compounds.4.10 Phosphorus Compounds.4.11 Sulfur Compounds.4.12 Near-Infrared Spectra.4.13 Identification.References.5. Inorganic Molecules.5.1 Introduction.5.2 General Considerations.5.3 Normal Modes of Vibration.5.4 Coordination Compounds.5.5 Isomerism.5.6 Metal Carbonyls.5.7 Organometallic Compounds.5.8 Minerals.References.6. Polymers.6.1 Introduction.6.2 Identification.6.3 Polymerization.6.4 Structure.6.5 Surfaces.6.6 Degradation.References.7. Biological Applications.7.1 Introduction.7.2 Lipids.7.3 Proteins and Peptides.7.4 Nucleic Acids.7.5 Disease Diagnosis.7.6 Microbial Cells.7.7 Plants.7.8 Clinical Chemistry.References.8. Industrial and Environmental Applications.8.1 Introduction.8.2 Pharmaceutical Applications.8.3 Food Science.8.4 Agricultural Applications.8.5 Pulp and Paper Industries.8.6 Paint Industry.8.7 Environmental Applications.References.Responses to Self-Assessment Questions.Bibliography.Glossary of Terms.SI Units and Physical Constants.Periodic Table.Index.

2,802 citations


"Preliminary study on the use of nea..." refers background in this paper

  • ...Absorbance around 1110 nm 195 may reflect 2 overtone –OH stretching although a combination –S=O stretch has been 196 previously reported around 1020-1060 nm (Stuart, 2004) which may be relevant given 197 the occurrence of sulphur-containing volatile compounds in broccoli (Jacobsson, 198 Nielsen and Sjöholm, 2004)....

    [...]

  • ...=O stretch has been196 previously reported around 1020-1060 nm (Stuart, 2004) which may be relevant given197 the occurrence of sulphur-containing volatile compounds in broccoli (Jacobsson,198 Nielsen and Sjöholm, 2004)....

    [...]

Book ChapterDOI
TL;DR: In this article, the distribution at which Student arrived was obtained in a more rigorous manner in 1925 by R.A. Fisher, who at the same time showed how to extend the application of the distribution beyond the problem of significance of means, which had been its original object, and applied it to examine regression coefficients and other quantities obtained by least squares, testing not only the deviation of a statistic from a hypothetical value but also the difference between two statistics.
Abstract: The accuracy of an estimate of a normally distributed quantity is judged by reference to its variance, or rather, to an estimate of the variance based on the available sample. In 1908 “Student” examined the ratio of the mean to the standard deviation of a sample.1 The distribution at which he arrived was obtained in a more rigorous manner in 1925 by R.A. Fisher,2 who at the same time showed how to extend the application of the distribution beyond the problem of the significance of means, which had been its original object, and applied it to examine regression coefficients and other quantities obtained by least squares, testing not only the deviation of a statistic from a hypothetical value but also the difference between two statistics.

1,472 citations

Journal ArticleDOI
TL;DR: HSI equipment, image acquisition and processing are described; current limitations and likely future applications are discussed; and recent advances in the application of HSI to food safety and quality assessment are reviewed.
Abstract: Hyperspectral imaging (HSI) is an emerging platform technology that integrates conventional imaging and spectroscopy to attain both spatial and spectral information from an object. Although HSI was originally developed for remote sensing, it has recently emerged as a powerful process analytical tool for non-destructive food analysis. This paper provides an introduction to hyperspectral imaging: HSI equipment, image acquisition and processing are described; current limitations and likely future applications are discussed. In addition, recent advances in the application of HSI to food safety and quality assessment are reviewed, such as contaminant detection, defect identification, constituent analysis and quality evaluation.

1,208 citations


"Preliminary study on the use of nea..." refers background in this paper

  • ...…to predict constituent concentrations in a sample at pixel level.51 The number of research applications of hyperspectral analysis has risen considerably in52 the food sector in the recent past (Burger and Gowen, 2011; Gowen et al., 2007;53 Lorente et al., 2012; McGoverin et al., 2010; Sun, 2010)....

    [...]

  • ...Reflectance imaging is the most common image acquisition mode and is usually46 carried out in either the visible-near infrared (vis-NIR; 400-1000 nm) or near infrared47 (NIR; 1000-1700 nm) spectral regions (Gowen et al., 2007)....

    [...]

Journal ArticleDOI
TL;DR: The effects of various factors in the supply chain of Brassica vegetables including breeding, cultivation, storage and processing on intake and bioavailability of GLSs are extensively discussed in this article.
Abstract: Glucosinolates (GLSs) are found in Brassica vegetables. Examples of these sources include cabbage, Brussels sprouts, broccoli, cauliflower and various root vegetables (e.g. radish and turnip). A number of epidemiological studies have identified an inverse association between consumption of these vegetables and the risk of colon and rectal cancer. Animal studies have shown changes in enzyme activities and DNA damage resulting from consumption of Brassica vegetables or isothiocyanates, the breakdown products (BDP) of GLSs in the body. Mechanistic studies have begun to identify the ways in which the compounds may exert their protective action but the relevance of these studies to protective effects in the human alimentary tract is as yet unproven. In vitro studies with a number of specific isothiocyanates have suggested mechanisms that might be the basis of their chemoprotective effects. The concentration and composition of the GLSs in different plants, but also within a plant (e.g. in the seeds, roots or leaves), can vary greatly and also changes during plant development. Furthermore, the effects of various factors in the supply chain of Brassica vegetables including breeding, cultivation, storage and processing on intake and bioavailability of GLSs are extensively discussed in this paper.

531 citations

Journal ArticleDOI
TL;DR: The different technologies available to acquire the images and their use for the non-destructive inspection of the internal and external features of these products are explained, with details of the statistical techniques most commonly used for this task.
Abstract: Hyperspectral imaging systems are starting to be used as a scientific tool for food quality assessment. A typical hyperspectral image is composed of a set of a relatively wide range of monochromatic images corresponding to continuous wavelengths that normally contain redundant information or may exhibit a high degree of correlation. In addition, computation of the classifiers used to deal with the data obtained from the images can become excessively complex and time-consuming for such high-dimensional datasets, and this makes it difficult to incorporate such systems into an industry that demands standard protocols or high-speed processes. Therefore, recent works have focused on the development of new systems based on this technology that are capable of analysing quality features that cannot be inspected using visible imaging. Many of those studies have also centred on finding new statistical techniques to reduce the hyperspectral images to multispectral ones, which are easier to implement in automatic, non-destructive systems. This article reviews recent works that use hyperspectral imaging for the inspection of fruit and vegetables. It explains the different technologies available to acquire the images and their use for the non-destructive inspection of the internal and external features of these products. Particular attention is paid to the works aimed at reducing the dimensionality of the images, with details of the statistical techniques most commonly used for this task.

444 citations


"Preliminary study on the use of nea..." refers background in this paper

  • ...…to predict constituent concentrations in a sample at pixel level.51 The number of research applications of hyperspectral analysis has risen considerably in52 the food sector in the recent past (Burger and Gowen, 2011; Gowen et al., 2007;53 Lorente et al., 2012; McGoverin et al., 2010; Sun, 2010)....

    [...]

Frequently Asked Questions (1)
Q1. What are the contributions mentioned in the paper "Preliminary study on the use of near infrared hyperspectral imaging for quantitation and localisation of total glucosinolates in freeze-dried broccoli" ?

1 The use of hyperspectral imaging to ( a ) quantify and ( b ) localise total glucosinolates in 2 florets of a single broccoli species has been examined. Two different spectral regions 3 ( vis-NIR and NIR ), a number of spectral pre-treatments and different mask development 4 strategies were studied to develop the quantitative models. The procedure demonstrates potential for the 7 quantitative screening and localisation of total glucosinolates in broccoli using the 9508 1650 nm wavelength range.