
All figures (10)
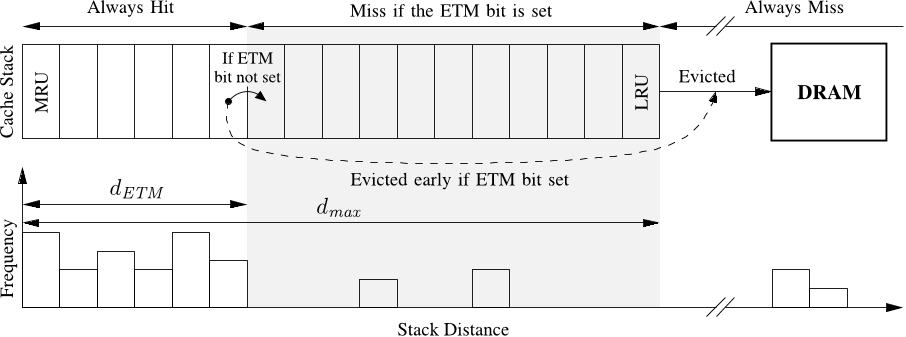
Figure 5. LRU stack (top) and the forward stack distance distribution of a memory accessing instruction (bottom). If the ETM bit is set the cache lines are evicted early to DRAM when they reach dETM . The bars within the shaded area of the forward stack distances distribution represent memory accesses that will result in cache misses if the ETM bit is set. An instruction is classified as non-temporal if there are less than tm forward stack distances between dETM and dmax and at least one forward stack distance greater than dmax . 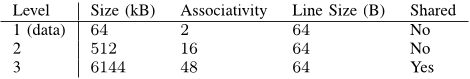
Table I CACHE PROPERTIES OF THE MODEL SYSTEM (AMD PHENOM II X4 920) 
Figure 1. Miss ratio as a function of cache size for an application with streaming behavior and a typical non-streaming application that reuses most of its data. When run in isolation, each application has access to both the private cache and the entire SLLC. Running together causes the non-streaming application to receive a small fraction of the SLLC, while the streaming application receives a large fraction without decreasing its miss ratio. The change in perceived cache size and miss ratio is illustrated by the arrows. 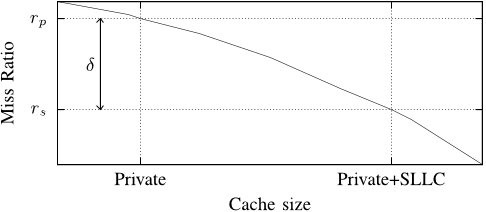
Figure 2. A generalized miss ratio curve for an application. The minimum, i.e. only the private cache, and the maximum, i.e. the private cache and the full shared cache, amount of cache available to an application are shown on the x-axis. The miss ratio when running in isolation (rs) is the smallest miss ratio that an application can achieve on this system, while the miss ratio when running only in the private cache (rp) is the worst miss ratio. The δ represents how much an application is affected by competition for the shared cache. 
Figure 9. Performance of mixes with benchmarks from two different categories. Benchmarks from different categories are separated by a dotted line. All of the benchmarks, except for the Don’t care category, generally run slower in mixes than in isolation. Disabling caching for non-temporal memory accesses regains some of the IPC lost to cache and bandwidth contention without any negative impact on application performance in isolation. 
Figure 3. Classification map of a subset of the SPEC2006 benchmarks running with the reference input set on a system with a 576 kB private cache and 6MB shared cache. The quadrants signify different behaviors when running together with other applications. Applications to the left tend to reuse almost all of their data in the shared cache and generally work well with other applications, applications to the right tend to use large parts of the shared cache for data that is never reused and are generally troublesome in mixes with other applications. Applications in the upper half are sensitive to the amount of data that can be stored in the shared cache, while applications on the bottom are insensitive. 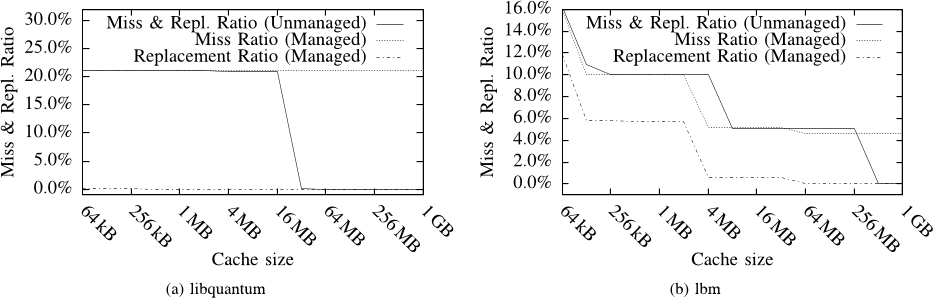
Figure 6. Miss and replacement ratio before and after cache managing the benchmarks to avoid caching of non-temporal data. The number of replacements can be reduced by cache management in both applications. The number of misses in (b) can be reduced, particularly around the target cache size, because a reduction in the number of replacements will allow more temporal data to fit in the cache. The miss ratio normally drops to 0% once the entire data set fits in the cache, this is no longer the case for managed applications, since the non-temporal memory accesses always cause a miss. 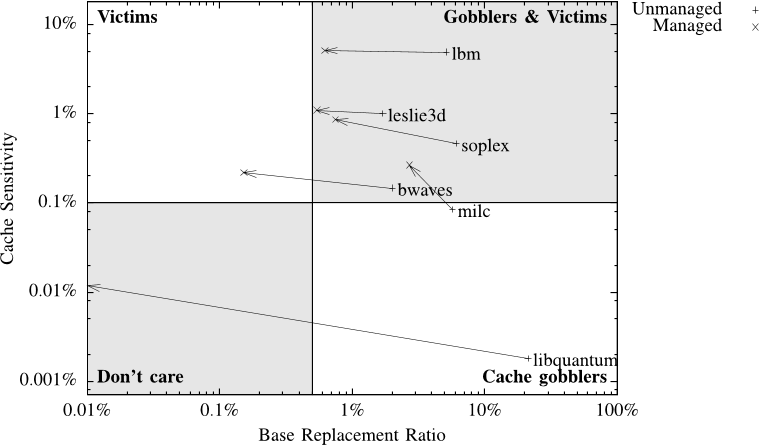
Figure 7. Changes in classification after disabling caching of non-temporal memory accesses. Note that this classification is based on the replacement ratio rather than the miss ratio. 
Figure 4. Reuse distance in a memory access stream. The arcs connect successive memory accesses to the same cache line, and represents the reuse of cache lines. The stack distance of the second memory access to A is equal to the number of arcs that cross “Out Boundary”. 
Figure 8. Performance for a mix of four applications, each from a different category. The IPC plot compares the IPC for managed and unmanaged benchmarks, both in a mix and in isolation. The speedup is relative to the unmanaged mix.


13 Nov 2010-