
All figures (72)
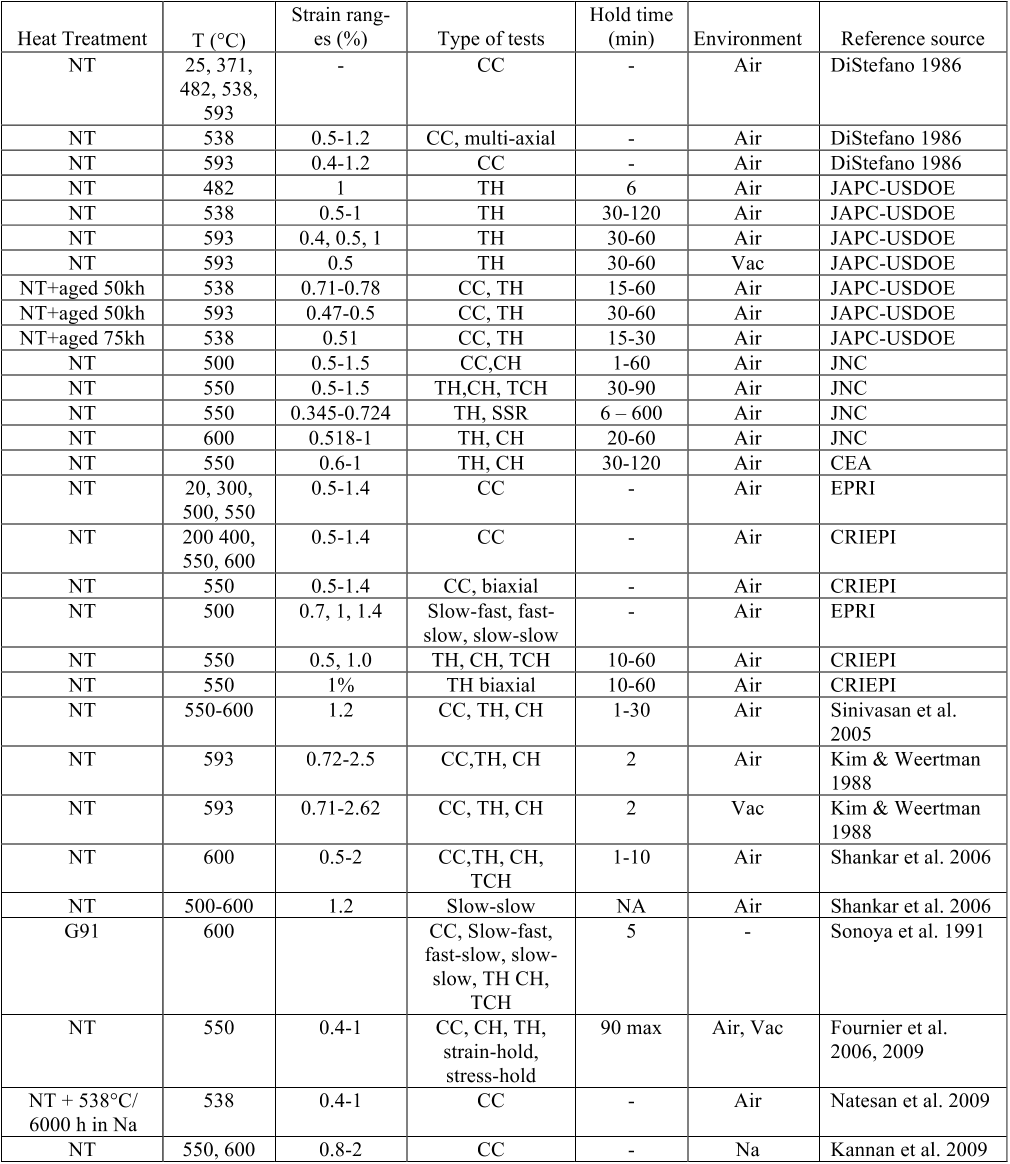 Table 6.4. Summary of fatigue and creep-fatigue data of mod.9Cr-1Mo
 Table 7.1. Creep-fatigue crack growth loading parameters (Riedel 1986).
 Figure 7.5. Cyclic crack growth rate vs inverse loading frequency for various mechanisms (Reidel, 1986). Schematic for n=6 and χ =5.
 Figure 8.2. (left) Temperature shifts for F82H fitted to √dpa dependence for a range of Ti, and (right) Temperature shifts for 9Cr-1Mo fitted to a √dpa dependence (Yamamoto et al. 2006).
 Table 6.2. Creep-fatigue data of austenitic stainless steels and their weldments
 Table 4.2. Thermal aging data and post-aging mechanical tests for G91
 Figure 5.14. Maximum axial strain versus number of cycles from tension-torsion ratcheting tests for Mod. 9Cr-1Mo at 550°C and several values of the constant axial stress (Yaguchi and Takahashi 2005a).
 Table 6.1. Creep-fatigue data of austenitic stainless steels, 304 and 316.
 Table 3.3. Type 304 stainless steel information in Subsection NH
 Figure 7.2. Schematic of a large and small fatigue crack propagation behavior illustrating the small crack effects Saxena (1998).
 Table 3.2. Product forms of 316SS permitted under Subsection NH.
 Figure 7.15. Modified 9Cr1Mo weld metal crack growth data at 600ºC. The base metal crack growth rate scatter band is superposed on the plot. Test data from the SOTA Program (Shibli and Mat Hamata 2001).
 Figure 9.1. Negligible creep curves for Mod. 9Cr-1Mo based only on the time-fraction criterion (Jetter et al. 2009).
 Figure 5.20. Larson-Miller plot of creep rupture data for (top left) 304H, (top right) 316H, (bottom left) 2¼ Cr-1Mo, and (bottom right) Mod. 9Cr-1Mo (Swindeman 2008).
 Table 5.1. Description of creep rupture databases compiled by Swindeman (2008)
 Figure 5.1. Hysteresis loops for 304 stainless steel at room temperature (Hassan and Kyriakides 1994).
 Figure 8.9. The (left) fracture toughness and (right) tearing modulus of modified 9Cr-1Mo steel irradiated in FFTF to doses as high as 105 dpa, and tested at temperatures from room to about 425°C.
 Figure 8.10. Fracture toughness, KJc, values adjusted to 1T size for 9Cr1MoV steel in annealed condition. The overall T0 value is -25.4°C with all specimen types giving the same T0 within 2°C (Nanstad et al. 2007).
 Figure 8.3. Schematic diagrams showing (a) a typical load vs load-line displacement trace from a single specimen unloading compliance test, (b) the J vs crack extension plot (resulting from analysis of the load-displacement trace) used to determine the J-R curve, JIc, and the tearing modulus (based on the J-R curve slope dJ/da), and (c) the region of qualified data for the analysis (ASTM, 2005).
 Figure 6.6. Schematics of two types of damage observed in 9-12% ferritic-martensitic steels (Fournier at al 2009).
 Figure 7.6. Cyclic crack growth rate, da/dn, as a function of K for 1Cr-1Mo-0.25V steel at 538°C for loading waveforms with varying hold times from 0 to 8 hours. The 0 hold time tests were at loading frequencies of 1Hz and 0.083Hz. The loading/unloading times for the 0.083Hz match the loading/unloading times for the hold time tests (Adefris et al. 1996).
 Figure 5.15. Different creep rates at the same stress level but with different prior plastic strains, or maximum stress levels, 316SS (Ohashi et al. 1986).
 Figure 5.7. Creep strain versus time curves for different stresses and temperatures in log-scale (Swindeman 1988).
 Figure 7.14. Modified 9Cr-1Mo CCG and CFCG rates at 625°C from CT specimens (Wasmer et al. 2003).
 Figure 7.1. Stress-strain behavior of an element of material approaching the crack tip Saxena (1998).
 Table 3.1. Chemical composition of Type 304 and 316 stainless steels.
 Figure 7.9. Low chromium steels. CCG rate vs Ct for base metals, exposed and unexposed to service. CCG test temperature range is 538– 550ºC (Saxena et al. 1988).
 Figure 5.6. Stress versus strain hysteresis loops for 0.95% strain range, showing (a) the effect of cycle number at a strain rate of 10-4/s, and (b) the effect of strain rate at 550°C (Swindeman 1988).
 Figure 5.5. Monotonic engineering stress-strain curves for Mod. 9Cr-1Mo. (a) Effects of temperature at a strain rate of 6.7x10⁻⁵/s. (b) Strain rate effects at 600°C (Swindeman 1988).
 Figure 5.9. Stress relaxation behavior with different prior strain rates at (a) 400ºC, and (b) 550ºC for Mod. 9Cr-1Mo (Yaguchi and Takahashi 1999).
 Figure 5.9. Stress relaxation behavior with different prior strain rates at (a) 400ºC, and (b) 550ºC for Mod. 9Cr-1Mo (Yaguchi and Takahashi 1999).
 Table 4.1. Isothermal aging data for 2.25Cr-1Mo steel.
 Figure 6.3. Comparison of fatigue data of normalized and tempered 2.25Cr-1Mo with data of annealed 2.25Cr-1Mo and ASME fatigue design curves.
 Figure 8.5. Fracture toughness data for uniradiated F82H versus temperature after correcting for various specimen size effects (Odette et al. 2004).
 Figure 8.4. The test procedure in E-1921 allows the determination of To with a relatively small number of relatively small specimens. The results from (a) six small (0.5T) specimens tested at one temperature provide an excellent characterization of the results from (b) a large number of specimens up to 4T size (McCabe et al. 2000).
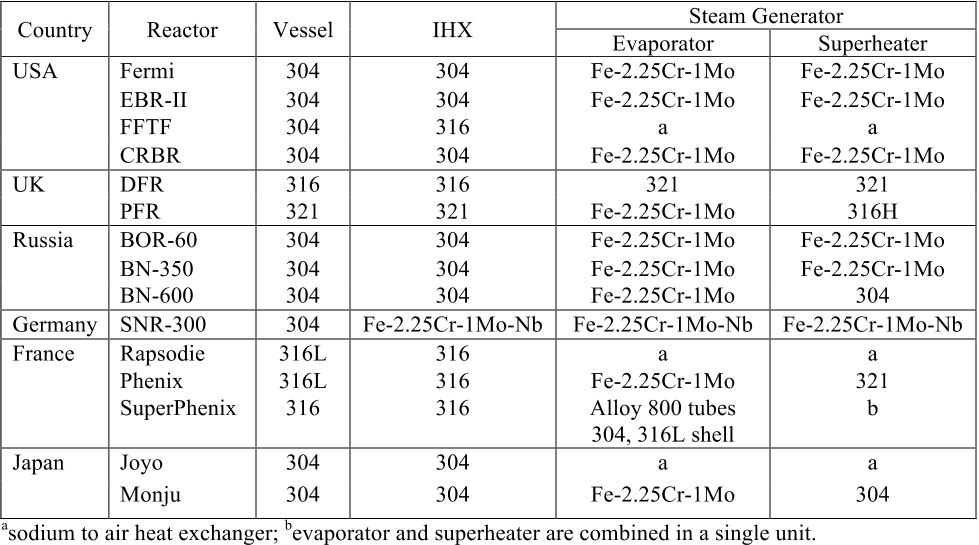 Table 2.2. Materials used in past sodium-cooled reactors.
 Table 2.3. Materials included in Subsection NH and allowables.
 Figure 6.7. Comparison of predicted creep-fatigue life with experimental data (Fournier et al. 2009).
 Figure 5.16. Influence of prior creep behavior on tensile behavior, 304SS (Pugh et al. 1972).
 Figure 6.5. TEM micrographs showing microstructural changes after fatigue deformation (a)asreceived, (b) pure fatigue (0.7%/550°C), (c) creep-fatigue (0.7%/550°C/hold time of 90 min) (Fournier et al. 2006).
 Figure 7.12. Modified 9Cr-1Mo CCG data at 550°C. Transient data have been removed from the plot (Ancelet and Chapuliot 2008).
 Figure 7.13. Modified 9Cr1Mo FCG data in the Stage II Paris regime, 550ºC (Reytier 2004).
 Figure 5.10. Temperature dependency of peak stress and relaxed stress for Mod. 9Cr-1Mo (Yaguchi and Takahashi 1999).
 Figure 5.11. Results of uniaxial ratcheting tests at 550°C for Mod. 9Cr-1Mo. Tests were performed at the same maximum stress of 400 MPa but for several negative stress ratios (Yaguchi and Takahashi 2005a).
 Figure 7.20. 316 stainless steel (Tabuchi et al. 1990). Fracture mode of the test: W=wedge cracking, T=transgranular fracture, and C=cavity formation
 Figure 7.18. 316 and 316L (N) stainless steel CCG data at temperature below 600°C (Shibli et al. 1998).
 Figure 5.23. Fracture mechanism maps for (low boron) 316 stainless steel (Fields et al. 1980).
 Figure 5.24. Fracture mechanism maps for 2¼ Cr-1Mo steel (Fields et al. 1980).
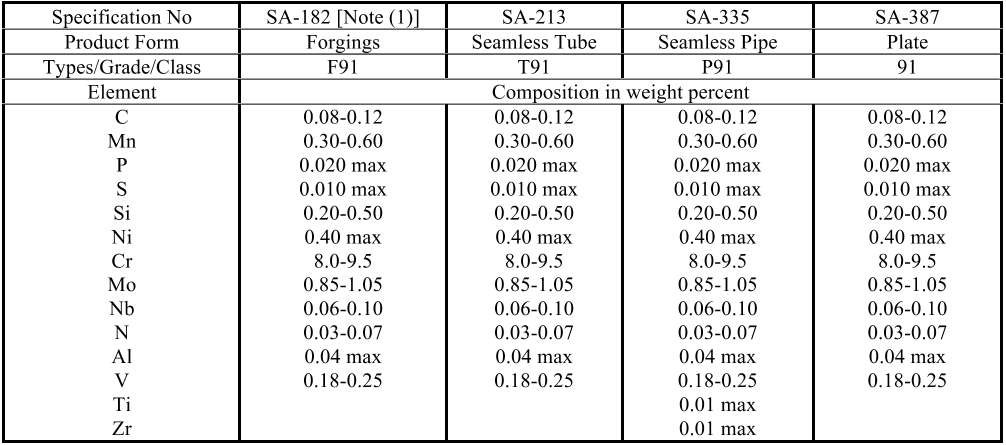 Table 3.6. ASME III-NH permissible chemical specifications for mod.9Cr-1Mo steel
 Table 3.7. Information for G91 in Subsection NH
 Table 3.5. 2.25Cr-1Mo steel information in Subsection NH
 Table 11.1. A listing of technical issues, resolution approach, and priority for resolution
 Figure 5.3. Behavior of shear strain progression in the first 5 cycles from tension-
 Table 2.1. Key design parameters for the LMR concepts
 Figure 7.3. Creep crack growth rate as a function of the C*-integral for 304 stainless steel (Saxena 1998).
 Figure 6.8. Comparison between experiment and modeling of cyclic stress response as a function of number of cycles (Aktaa and Schmitt 2006).
 Figure 7.8. Grain boundary cavity, showing atom flow from cavity surface toward its tip, and into the grain boundary (Chuang et al. 1979).
 Figure 5.18. The influence of prior creep deformation on the room temperature cycling behavior, 304SS (Pugh et al. 1972).
 Figure 4.4. Yield strength reduction factor as a function of temperature and time for 2.25Cr-1Mo. Values are from NH Table NH-3225-3A.
 Table 4.3. Yield and tensile strength reduction factors for NH materials
 Figure 6.2. Weldment fatigue specimen types (Corum 1990).
 Figure 4.2. Metallographic Atlas of creep-tested specimens for times up to 100,000 h at temperatures of 450 to 650°C for annealed 2.25Cr-1Mo (Kushima et al. 2005).
 Figure 8.7. Comparison of the J-R curves between Grade 91 and SA508-Gr.3 at (a) RT and (b) 288°C (Yoon and Yoon, 2006).
 Table 6.3. Summary of creep-fatigue data for 2.25Cr-1Mo steel
 Figure 5.2. Stress-strain curves obtained from strain-controlled ratcheting tests on 316FR stainless steel at (a) 300°C, and (b) 650°C. Uniaxial tensile curves are superposed in the plots. Straining history is shown schematically in the figure inset (Ohno et al. 1998).
 Figure 6.1. Different types of waveforms: (a) continuous cycling (CC), (b) tension hold only (TH), (c) compression hold only (CH), (d) tension and compression hold (TCH), (e) slow-fast waveform, (f) fast-slow waveform. (Note: slowslow waveform refers to a balanced waveform with a slower strain rate).
 Table 7.2. Crack growth rate correlations for various materials
 Figure 5.21. Classification of fracture mechanisms
 Table 3.4. Type 316 stainless steel information in Subsection NH
 Table 6.5. Fatigue and creep-fatigue data for mod.9Cr-1Mo weldments.
 Figure 7.17. Modified 9Cr-1Mo base metal and heat-affected zone CCG and CFCG data at 625ºC. Test data from the HIDA Program (Shibli and Mat Hamata 2001).
 Figure 8.12. J-integral vs crack extension results at 100, 175, and 250°C for specially heat treated 2.25Cr-1Mo (yield strength of 270 MPa at room temperature). The results demonstrate a significant loss of tearing resistance with increasing temperature.


