All figures (11)
 Table B.1: Summary statistics
 Figure 6: Average k-period-ahead GDP Growth rates vs. debt threshold levels τ, quarterly OECD data, 1996Q01 to 2018Q2
 Figure D.8: Individual Country plots of debt-to-GDP ratio, Reinhart and Rogoff (2010), 1946 to 2009
 Figure D.7: Individual Country plots of GDP Growth, Reinhart and Rogoff (2010), 1946 to 2009
 Figure 1: GDP Growth, Reinhart and Rogoff (2010) data, 1946 to 2009
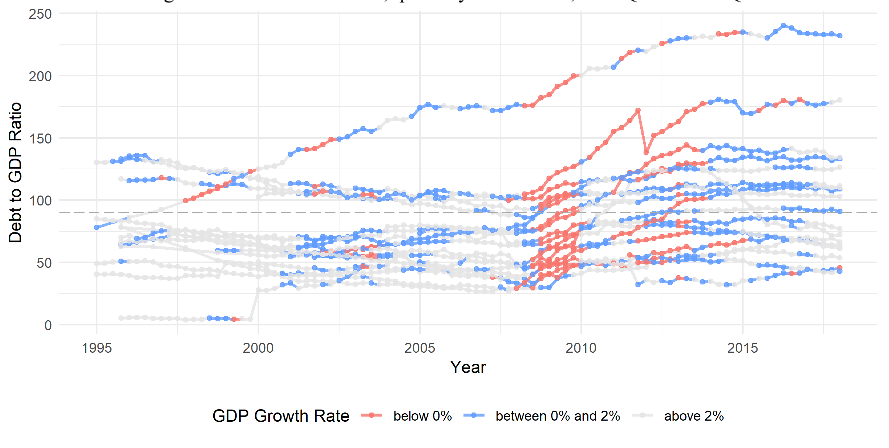 Figure 4: Debt-to-GDP ratio, quarterly OECD data, 1996Q01 to 2018Q2
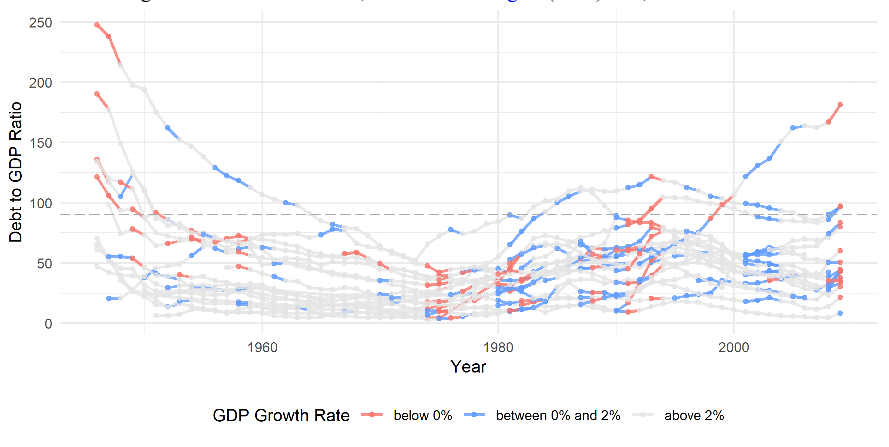 Figure 3: Debt-to-GDP ratio, Reinhart and Rogoff (2010) data, 1946 to 2009
 Figure D.10: Individual Country plots of debt-to-GDP ratio, quarterly OECD data, 1996Q01 to 2018Q2
 Figure D.9: Individual Country plots of GDP Growth, quarterly OECD data, 1996Q01 to 2018Q2
 Figure 5: Average k-period-ahead GDP growth rates vs. debt threshold levels τ, Reinhart and Rogoff (2010) data, 1946 to 2009
 Figure 2: GDP Growth, quarterly OECD data, 1996Q01 to 2018Q2


