Risk Shifting and Mutual Fund Performance
Figures (11)

Table 7: Performance Consequences Using Alternative Risk Shifting Measures This table reports the abnormal monthly returns of portfolios of mutual funds sorted according to the most recent risk shifting measure. We compute six different measures of risk shifting: the standard deviation of the fund returns using all holdings; the proportion of the portfolio invested in cash and other non-equity securities; the standard deviation of the returns using only equity positions; the systematic risk, defined as the CAPM beta; and the idiosyncratic risk, defined as the standard deviation of the residuals from the CAPM and Carhart regressions, respectively. All returns are expressed in % per month. Portfolios 1 to 5 are defined similarly to Table 2 with different cutoffs for each RS measure: {±1%,±2.5%} for all holdings; {±2.5%,±7.5%} for cash proportions; {±1%,±2%} for equity holdings; {±.05,±0.15} for CAPM beta; and {±1%,±2%} for both idiosyncratic risk measures. The significance levels are abbreviated with asterisks: One, two, and three asterisks denote significance at the 10, 5, and 1% level, respectively. 
Table 3: Mechanisms of Risk Shifting. This table summarizes the initial levels (Panel A) and the changes (Panel B) in the fund characteristics that determine the total risk of a fund. The initial levels correspond to the average characteristics over the prior 36 months and the changes correspond to the difference between the most recent characteristics and the average characteristics over the prior 36 months according to the most recent risk shifting measure. Portfolios 1 to 5 are defined in Table 2 with cutoff RS measures of {±1%,±2.5%}. 
Figure 1: Persistence of Risk Shifting. The figure depicts the average risk shifting level for the five risk shifting portfolios four quarters before and eight quarters after the portfolio formation. 
Table 4: Performance Consequences of Risk Shifting This table reports the abnormal monthly returns of portfolios of mutual funds sorted according to the most recent risk shifting measure. The table summarizes the intercepts from factor regressions based on the CAPM, Fama-French, Carhart, and Ferson-Schadt models. All returns are expressed in % per month. Portfolios 1 to 5 are defined in Table 2 with cutoff RS measures of {±1%,±2.5%}. The significance levels are abbreviated with asterisks: One, two, and three asterisks denote significance at the 10, 5, and 1% level, respectively. 
Table 5: Longer-Term Performance Consequences of Risk Shifting This table reports Carhart-adjusted monthly returns of portfolios of mutual funds sorted according to the prior risk shifting measure. The performance of the fund portfolios is computed based on the risk shifting measures of funds over the prior four quarters. All returns are expressed in % per month. Portfolios 1 to 5 are defined in Table 2 with cutoff RS measures of {±1%,±2.5%}. The significance levels are abbreviated with asterisks: One, two, and three asterisks denote significance at the 10, 5, and 1% level, respectively. 
Table 1: Summary Statistics This table summarizes the characteristics of the mutual funds in our sample over the period between 1980 and 2006. 
Figure 3: Cumulative Distribution Function. We report the cumulative distribution functions of the fund rankings for mutual funds in different risk shifting groups. We sort mutual funds into the five portfolios according to their most recent risk shifting measure. At the end of every quarter we compute the cumulative distribution function of the percentile ranking of funds based on the Carhart alphas over the subsequent 12-month period for each of the five portfolios. Finally, we depict the average levels of the quarterly cumulative distribution functions. The figure shows the cumulative distributions for three different groups of mutual funds. The curve RS1 corresponds to funds in portfolio (1) that reduce their risk by more than 2.5%, RS5 to funds that increase their risk by more than 2.5%, and RS3 for funds that change their risk by less than 1%. All returns are expressed in % per month. 
Table 2 summarizes the characteristics of mutual funds sorted according to the RS measure. Funds in Portfolio 1 decrease risk on average by 5.60% per year, which is approximately 26% of their realized volatility over the prior 36 months. On the other hand, funds in Portfolio 5 increase risk by 4.75% per year, which is also approximately 26% of their prior realized volatility. Thus, funds exhibit significant changes in their overall risk levels over time. 
Table 8: Performance of Funds by Risk Shifting and Other Fund Characteristics This table reports the frequency distribution and the Carhart alphas of portfolios of mutual funds sorted according to risk shifting and other fund characteristics that are related to trading costs and prior fund performance (turnover, prior year flow, prior year return, and realized volatility over prior 3 years). Mutual funds are first sorted into two equal-sized groups according to whether the characteristic is above or below its median value. In a second step, funds are further divided into five groups according to their risk shifting level. The table reports the average proportion of funds that fall into one of the ten groups and the Carhart alphas of the ten portfolios and the differences in the Carhart alphas between selected portfolios. All returns are expressed in % per month. Portfolios 1 to 5 are defined in Table 2 with cutoff RS measures of {±1%,±2.5%}. The significance levels are abbreviated with asterisks: One, two, and three asterisks denote significance at the 10, 5, and 1% level, respectively. 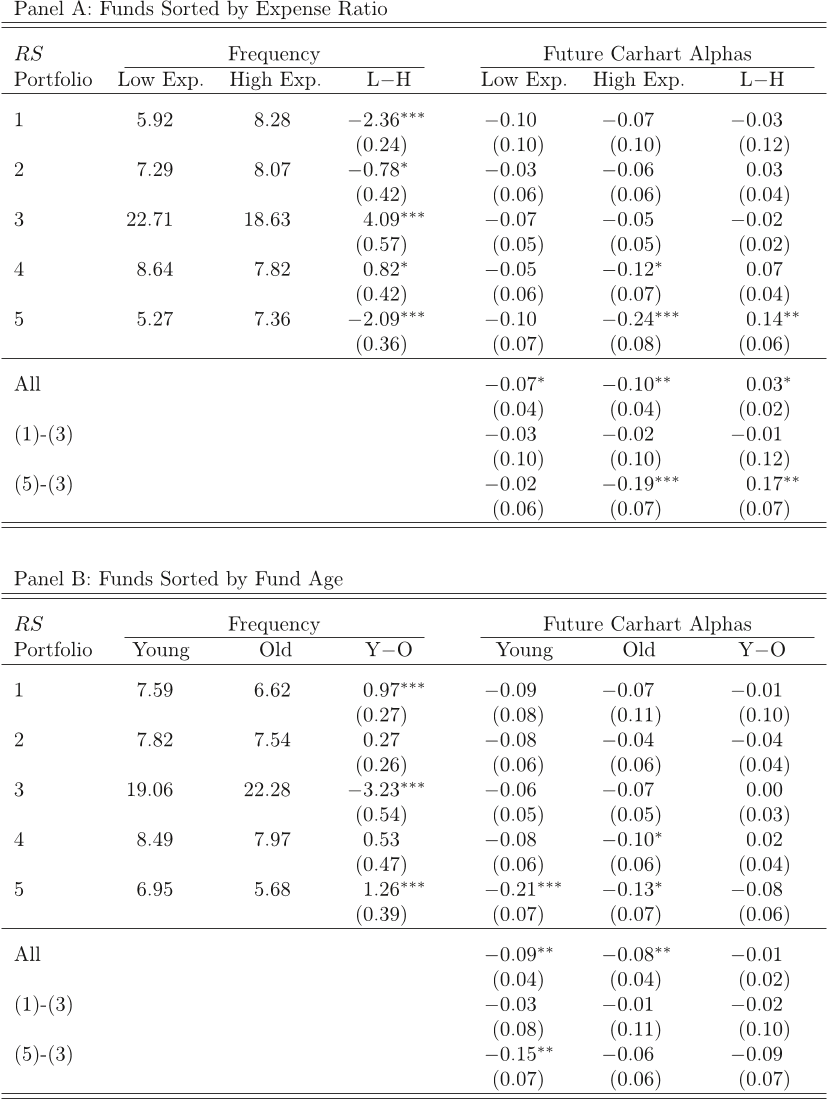
Table 6: Performance of Funds with Different Risk Shifting Incentives This table reports the frequency distribution and the future Carhart alphas of portfolios of mutual funds sorted according to risk shifting and fund characteristics that are related to risk shifting incentives (expense ratio, age, size, and fund family size). Mutual funds are first sorted into two equal-sized groups according to whether the characteristic is above or below its median value. In a second step, funds are further divided into five groups according to their risk shifting level. The table reports the average proportion of funds that fall into one of the ten groups and the Carhart alphas of the ten portfolios and the differences in the future Carhart alphas between selected portfolios. All returns are expressed in % per month. Portfolios 1 to 5 are defined in Table 2 with cutoff RS measures of {±1%,±2.5%}. The significance levels are abbreviated with asterisks: One, two, and three asterisks denote significance at the 10, 5, and 1% level, respectively. 
Figure 2: Future Performance of Portfolios by Risk Shifting Measure. This figure depicts the abnormal monthly returns of portfolios of mutual funds sorted according to the most recent risk shifting measure. The figure summarizes the intercepts from factor regressions based on the CAPM, Fama-French, Carhart, and Ferson-Schadt models. All returns are expressed in % per month.


Citations
474 citations
286 citations
231 citations
223 citations
212 citations
References
24,874 citations
"Risk Shifting and Mutual Fund Perfo..." refers methods in this paper
...To adjust for risk and style effects, abnormal returns are computed using the one-factor CAPM, the Fama and French (1993), the Carhart (1997), and the Ferson and Schadt (1996) models....
[...]
14,171 citations
13,218 citations
"Risk Shifting and Mutual Fund Perfo..." refers background or methods in this paper
...The idiosyncratic volatilities are computed as the standard deviations of the residuals from the CAPM or the Carhart factor regressions over the prior 36 months. Portfolio 1 (5) includes funds that decrease (increase) their idiosyncratic risk by more than 2% per year and Portfolio 3 includes funds that change their idiosyncratic risk by less than 1%. We find a strong relation between risk shifting and fund performance for portfolios sorted according to changes in idiosyncratic volatilities, but do not find a statistically significant return pattern for portfolios sorted according to changes in systematic risk. For example, the performance difference between funds that increase their idiosyncratic risk the most (in Portfolio 5) and funds that maintain stable risk levels (in Portfolio 3) is between -18 and -21 basis points per month, both significant at the 5% level, depending on whether idiosyncratic risk is measured relative to the market model or the four-factor Carhart model. On the other hand, the performance difference between funds that increase their systematic risk the most and funds that maintain stable systematic risk is -5 basis points per month and is not statistically significant. Thus, the poor performance of funds that increase risk is driven by the increase in their idiosyncratic risk levels and not by the increase in their systematic risk exposure. Our results suggest that the main driver of the poor performance of risk shifters is not their inability to time the aggregate market movements but their tendency to take on idiosyncratic risk.(12) (12)Ang, Hodrick, Xing, and Zhang (2006) report that stocks with high idiosyncratic volatility based on daily returns tend to exhibit relatively poor abnormal returns in the subsequent month....
[...]
...For example, high-expense funds in Portfolio 5 exhibit a Carhart alpha of -24 basis points per month, which is statistically significant at the 1% level, whereas low-expense funds in Portfolio 5 have an insignificant alpha of -10 basis points per month. The performance difference between high- and low-expense risk shifters (at 14 basis points per month) is substantially higher than the performance difference between all high- and low-expense funds (at only 3 basis points per month). Chevalier and Ellison (1997) find that younger funds with less established track records have a more convex flow-performance relation. Thus, younger mutual funds might have bigger incentives to shift risk. Similarly, smaller fund families also have more significant incentives to shift risk, as discussed in Huang, Wei, and Yan (2007). Panels B and C of Table 7 confirm that young funds and small fund families are more likely to shift risk and they experience particularly poor abnormal returns if they increase their risk levels....
[...]
...The Fama-French-Carhart model nests the CAPM model (which includes only the market factor) and the Fama-French model (which includes the size and the book-to-market factors in addition to the market factor)....
[...]
...To adjust for risk and style effects, abnormal returns are computed using the one-factor CAPM, the Fama and French (1993), the Carhart (1997), and the Ferson and Schadt (1996) models....
[...]
...The first group of columns in Table 7 summarizes the frequency distribution of funds across the two groups and the last group of columns reports the subsequent Carhart alphas for the ten mutual fund portfolios.(13) Gil-Bazo and Ruiz-Verdu (2009) find that high-expense funds do not perform better than low-expense funds, even before subtracting expenses....
[...]
4,050 citations
4,048 citations