
All figures (11)
 Fig. 6. Absolute total silica mass balance (DSi þ ASi). Error bars represent deviation from conservative mass balance, represented as percent in both directions.
 Fig. 7. PCA correlation circle of Table 3. Variation of numeric variables is maximized along two components. Meanwater depth (‘‘depth’’), riverine ASi and DSi (‘‘asisch’’ and ‘‘ dsisch’’) and mean water temperature (‘‘t’’) are shown with ASi and DSi percent delivery (‘‘asi’’, ‘‘dsi’’). Parallel vectors are highly correlated along the two components, while squared vectors are not correlated. Opposite direction indicates a negative correlation. Explicit R-squared and p-values depend on the amount of variation explained by the components.
 Fig. 1. Schematic overview of study site before (A) and after building works (B). (C) Samp
 Fig. 8. DSi concentration profiles at all locations (see Fig. 3) sampled in the May 2006 campaign. Tidal pool (2) and lower mudflat (3), as well as outstream location (1) are shown in black, other locations in grey.
 Fig. 3. Water mass balance during a typical tide in Lippenbroek. Inset illustrates tidal curves (from Cox et al., 2006). Grey lines indicate (0) start instream, (110) stop instream ¼ start st Outstream consists of a bulk outstream (overmarsh tidal frame) and a seepage phase (here
 Fig. 2. Vegetation development in devegetated zones. A and B (upper) show overview; C and D (lower) detail. A and C are taken in spring 2006 (1 month after first inundations), B in summer 2006, and D in summer 2007.
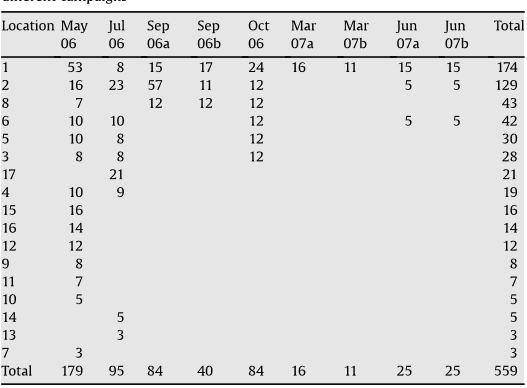 Table 1 Sampling intensity of DSi samples at different locations (see Fig. 1C) and during different campaigns
 Table 2 Selection of samples analysed for ASi at different locations (see Fig. 1C) and during different campaigns
 Fig. 4. DSi concentration profiles at in- and outstream location for all campaigns (tidal phases as in Fig. 3). Campaign month is indicated above each subpanel (dots are measured concentrations, lines represent linear extrapolation).
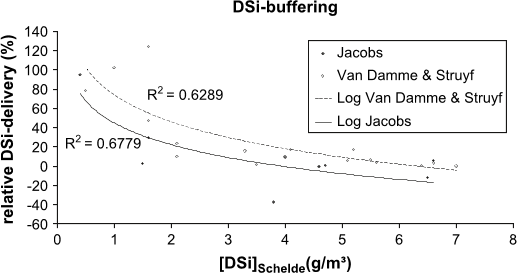 Fig. 9. Comparison of DSi-buffering capacity of reference tidal marshes (open points, dashed curve) and CRT (filled points, full curve). Reference data from Struyf et al. (2006) and Van Damme et al. (in preparation).
 Fig. 5. DSi (upper graphs) and ASi (lower graphs) mass balance of all campaigns. Balance is r delivered/retained) (right graphs). Error bars represent deviation from conservative mass b


