All figures (15)

Figure 3: (a) Comparison of single wire axial and transverse XRD pattern. (b) Comparison of XRD and neutron diffraction pattern in transverse direction. 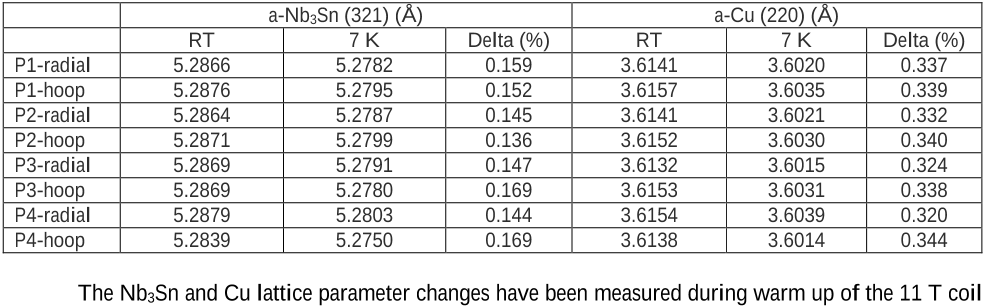
Table 5: Comparison between RT and 7 K Nb3Sn (321) and Cu (220) diffraction angles. 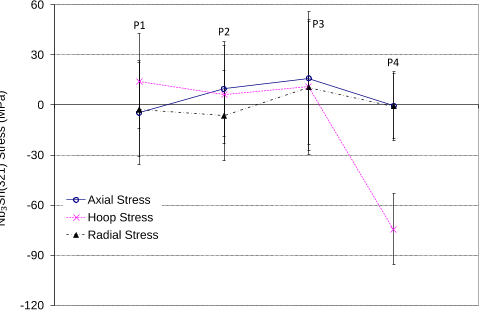
Figure 9: Residual Nb3Sn (321) stress in axial, hoop and radial directions in the centre of the four largest 11 T dipole conductor blocks. 
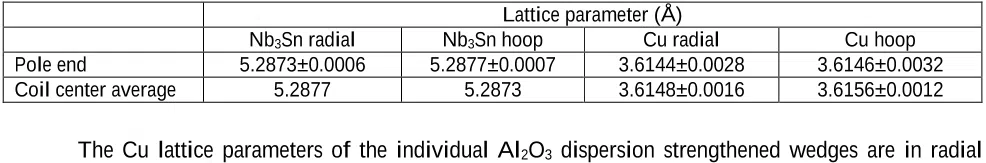
Table 2: Average Nb3Sn lattice parameters calculated from the Nb3Sn (321) and Cu (200) d-spacings in radial and hoop directions in the different coil cross sections. The standard deviation is mainly a measure for the d-spacing variation in the analysed volume. 
Figure 6: Nb3Sn (321) d-spacing distribution in the pole end segment in radial and hoop directions. 
Figure 1: (a) Sketch of ID15A test configuration. (b) 11 T coil slice on the goniometer of the ID15A sample stage. 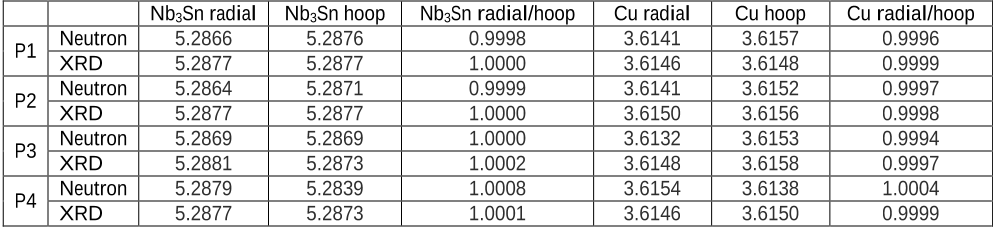
Table 3: Comparison of neutron diffraction and XRD results of Nb3Sn and Cu lattice parameters in radial and hoop directions in the four largest conductor blocks in the 11 T coil centre. Nb3Sn lattice parameters are calculated from the d-spacing of the (321) reflection. The Cu lattice parameter is calculated from the d-spacing of the (200) reflection (XRD) or the (220) reflection (neutron diffraction). The sample volume probed by XRD is 5×5×3 mm3, and the neutron diffraction nominal gauge volume is 5×5×5 mm3. 
Figure 7: (a) Micrograph of the conductor block center. (b) Nb3Sn (321) peak area and (c) radial/hoop Nb3Sn lattice parameter acquired by high resolution scans with 100 µm step size. 
Figure 10: Nb3Sn and Cu lattice parameter vs temperature during heating of sample coil 107-1, measurement position P1-radial. 
Figure 2: 4 cm-long segment of 11 T short model coil #107 mounted on the Stress-Spec sample stage in axial test configuration. The gauge volume centre positions in radial and hoop position are labelled. 
Table 4: Main Nb3Sn (321) and Cu (220) peak fit results and calculated elastic strain in radial, hoop and axial directions at RT. 
Figure 8: Residual Nb3Sn (321) strain in axial, hoop and radial directions in the centre of the four largest conductor blocks of the 11 T coil segment. 
Table 1: Comparison of the Nb3Sn, Nb and Cu lattice parameters calculated from the ID15A and Stress-Spec diffractograms. 
Figure 4: (a) Photograph of the Nb3Sn 11 T dipole coil. (b) Nb3Sn (321) diffraction peak intensity distribution across the same slice with a step size of 500 µm in horizontal and in vertical directions. 
Figure 5: Nb3Sn (321) and Cu (200) d-spacing distribution in the centre segment in radial and hoop directions.