scispace - formally typeset
Search or ask a question
Journal ArticleDOI

Subpixellic Methods for Sidelobes Suppression and Strong Targets Extraction in Single Look Complex SAR Images

TL;DR: This paper describes strategies to cancel sidelobes around point-like targets while preserving the spatial resolution and the statistics of speckle-dominated areas in synthetic aperture radar images.
Abstract: Synthetic aperture radar (SAR) images display very high dynamic ranges. Man-made structures (like buildings or power towers) produce echoes that are several orders of magnitude stronger than echoes from diffusing areas (vegetated areas) or from smooth surfaces (e.g., roads). The impulse response of the SAR imaging system is, thus, clearly visible around the strongest targets: sidelobes spread over several pixels, masking the much weaker echoes from the background. To reduce the sidelobes of the impulse response, images are generally spectrally apodized, trading resolution for a reduction of the sidelobes. This apodization procedure (global or shift-variant) introduces spatial correlations in the speckle-dominated areas that complicates the design of estimation methods. This paper describes strategies to cancel sidelobes around point-like targets while preserving the spatial resolution and the statistics of speckle-dominated areas. An irregular sampling grid is built to compensate the subpixel shifts and turn cardinal sines into discrete Diracs. A statistically grounded approach for point-like target extraction is also introduced, thereby providing a decomposition of a single look complex image into two components: a speckle-dominated image and the point-like targets. This decomposition can be exploited to produce images with improved quality (full resolution and suppressed sidelobes) suitable both for visual inspection and further processing (multitemporal analysis, despeckling, interferometry).

Summary (3 min read)

Introduction

  • Hence, a typical SAR image like the one shown in Fig. 1 (a) contains rather homogeneous areas with fluctuations due to speckle phenomenon (the larger the average intensity in the area, the larger are these fluctuations) and the signature of man-made structures in the form of intensities that are several orders of magnitude larger.
  • Visually, these fluctuations appear grainy, but, more importantly, these correlations impact statistical methods for speckle reduction.
  • Nonlinear processing methods were introduced in [5] under the name Spatially Variant Apodization (SVA) to reach this goal.
  • By retaining at each pixel the smallest amplitude among all amplitudes obtained by applying the family of apodization functions, sidelobes are kept minimum while preventing the widening of the main lobe.

II. PSEUDO-RAW IMAGE AND PSEUDO-RAW SPECTRUM

  • The SLC SAR images are, for reasons due to their acquisition process, band-limited and well-sampled signals.
  • Ω̂ of size m× n, showing that the pixel spacing was adjusted during the sampling process to (over) satisfy the Shannon-Nyquist criterion.
  • Besides, and as described in [29], the non-zero part of the Fourier spectrum is in fact apodized, which means that for any (α, β) ∈.
  • The authors refer the reader to [3], [28] for more details about the computation of the pseudo-raw image u0 from u (in particular in the case when the frequency attenuating function γ is unknown).
  • The reason why the spatial agencies introduce an apodization is to attenuate the sidelobes of the strong point target responses (highly present in urban areas) which are visible due to the SAR impulse response.

A. The cardinal sine impulse response model

  • In stripmap mode, the SAR imaging system (acquisition + SAR synthesis) exhibits an approximate separability in range and azimuth, with rectangular spectra in both dimensions.
  • Irregular resampling scheme proposed in [28], also known as Algorithm 1.
  • In (11d), the value U0(k−tx, `− ty) can be efficiently computed by evaluating the Shannon interpolation of the mono-dimensional signal ` 7→ uxtx (k, `) at the subpixellic position `−ty (this operation simply involves the inner product between the mono-dimensional discrete signal and a cardinal sine function).
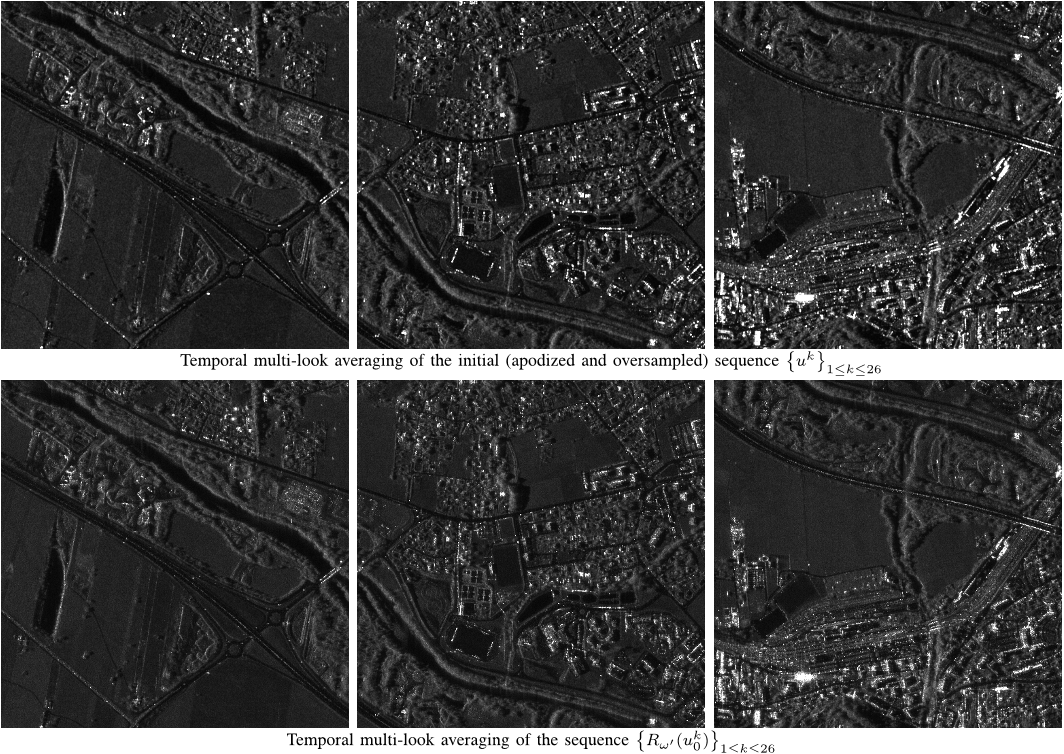
  • In Fig. 5 (c), the authors observe an interesting sidelobes removal but the spreading effect of strong targets is still present and this image also suffers from a negative bias of the gray levels (the image is darker).
  • The proposed irregular resampling procedure leads to a multi-look image with preserved spatial resolution and much well-localized targets.

C. Advantages and drawbacks

  • The proposed irregular resampling strategy provides a simple and efficient alternative to the traditional use of apodization or SVA.
  • More precisely, the complexities in time and memory are O(NTK|ω|) and O(NT |ω|) respectively, after the precomputation of NT FFTs in O(NT · |ω| log |ω|) during the initialization step.
  • Unfortunately, irregularly resampling the two images independently introduces some decoherences between the images, and their interferometric phase is not well preserved by this procedure as the authors shall see in the next section.
  • In summary, irregularly resampling pseudo-raw images in order to minimize the sidelobes effects of their neighboring bright targets leads to images that are at the same time of high resolution, statisti- cally accurate, and well-suited for visual interpretation.

IV. SPECKLE PLUS TARGETS DECOMPOSITION: A REVISITED CLEAN APPROACH

  • One containing the bright targets (described by their sub-pixellic positions and complex amplitudes) and another one containing the image that would have been observed without the bright targets.the authors.
  • The pixel with the brightest amplitude in the image is assumed to contain a target.
  • Under that viewpoint, the CLEAN algorithm corresponds to the mere matching pursuit [37] while the RELAX algorithm is closer to the orthogonal matching pursuit [38].
  • Is is important to note that both the CLEAN and RELAX approaches share the same weakness, they do not rely on a precise target detection criterion to decide whether a pixel of the image contains a strong target or not and the whole process does not rely on a satisfactory stopping criterion.
  • Numerous approaches for target detection have been proposed in the literature (see e.g., [39], [40]).

A. A contrario detection of bright targets centers

  • The a contrario methodology is a mathematical framework dedicated to the design of detectors providing a rigorous control of the number of false detections, that is, the average number of detections allowed in pure noise data.
  • Thus, the quantity Ru0x (k0, `0) should efficiently measure the ratio between the target amplitude and the local reflectivity.
  • The actual control of the average number of false detections (made in pure random data following H0) predicted by Proposition 1 is tested in Fig. 10.
  • In practice, the authors observe that it can be slightly higher, which is due to the imperfect approximation of the distribution of the random variables {Ru0(k, `)}(k,`)∈ω by a Rayleigh function (in particular for small values of K).

B. Speckle plus targets decomposition

  • One can remark that (19) also corresponds to the maximum likelihood estimator of A0 if the authors assume in (18) that w0 is a pure and stationary speckle (whatever its constant reflectivity).
  • Usually, the practical implementation of the a contrario detectors consists in extracting the ε-meaningful structures in decreasing NFA order.
  • Thus, in presence of several thousands of targets, the total execution time may exceed a day which can be problematic in many situations.
  • In general situations, this strategy avoids the recomputation of Ru0 over all the domain ω and offers a nice reduction of the execution time (in practice, by a factor 15).

C. Applications of the decomposition

  • First, it can be used to suppress the target sidelobes effect in the pseudo-raw image at arbitrary resolution.
  • The image Dω′(C ) defined in (22) is a linear combination of discrete Diracs centered at different positions of the grid ω′, and does not present any sidelobes.
  • In Fig. 15, the authors compare the coherence maps computed from apodized pairs of images (see Fig. 15 (a)), from pseudo-raw images (see Fig. 15 (b)), from irregular resamplings of those pseudo-raw images (see Fig. 15 (c)), or from the images obtained by applying the Rω operator to the pseudo-raw images (see Fig. 15 (d)).
  • On the other hand, over-coherent values can also be found in Fig. 15 (b) along the sidelobes of the strong targets (see the cross shape on the left side of Fig. 15 (b)).

V. CONCLUSION AND PERSPECTIVES

  • The authors addressed in two different ways the issue of sidelobes suppression with no loss of resolution and statistics preservation for pseudo-raw images.
  • The first proposed approach consists in resampling the pseudo-raw image over an irregular grid that efficiently cancels the sidelobes in the vicinity of the strong targets while preserving the speckle statistics (in particular the valuable spatial uncorrelation of the speckle in the pseudo-raw images) in fully developed speckle areas.
  • The derived revisited CLEAN algorithm exhibits a higher computational complexity than the resampling algorithm (its complexity is proportional to the size of the image multiplied by the number of targets found in the image).
  • The decomposition of the image that it provides is particularly suited to numerous SAR applications.
  • On the contrary, the authors can decide to only focus on the speckle-dominated component to perform tasks such as denoising, segmentation, classification, which may reveal more efficient in the absence of targets.

Did you find this useful? Give us your feedback

Figures (17)

Content maybe subject to copyright    Report

HAL Id: hal-01570857
https://hal-imt.archives-ouvertes.fr/hal-01570857v2
Submitted on 13 Nov 2017
HAL is a multi-disciplinary open access
archive for the deposit and dissemination of sci-
entic research documents, whether they are pub-
lished or not. The documents may come from
teaching and research institutions in France or
abroad, or from public or private research centers.
L’archive ouverte pluridisciplinaire HAL, est
destinée au dépôt et à la diusion de documents
scientiques de niveau recherche, publiés ou non,
émanant des établissements d’enseignement et de
recherche français ou étrangers, des laboratoires
publics ou privés.
Sub-pixellic Methods for Sidelobes Suppression and
Strong Targets Extraction in Single Look Complex SAR
Images
Rémy Abergel, Loïc Denis, Saïd Ladjal, Florence Tupin
To cite this version:
Rémy Abergel, Loïc Denis, Saïd Ladjal, Florence Tupin. Sub-pixellic Methods for Sidelobes Sup-
pression and Strong Targets Extraction in Single Look Complex SAR Images. IEEE Journal of
Selected Topics in Applied Earth Observations and Remote Sensing, IEEE, 2018, 11 (3), �10.1109/JS-
TARS.2018.2790987�. �hal-01570857v2�

SUB-PIXELLIC METHODS FOR SIDELOBES SUPPRESSION AND STRONG TARGETS EXTRACTION IN SINGLE LOOK COMPLEX SAR IMAGES 1
Sub-pixellic Methods for Sidelobes Suppression and Strong
Targets Extraction in Single Look Complex SAR Images
R
´
emy Abergel, Lo
¨
ıc Denis, Sa
¨
ıd Ladjal and Florence Tupin
Abstract—SAR images display very high dynamic ranges. Man-made
structures (like buildings or power towers) produce echoes that are several
orders of magnitude stronger than echoes from diffusing areas (vegetated
areas) or from smooth surfaces (e.g., roads). The impulse response of
the SAR imaging system is thus clearly visible around the strongest
targets: sidelobes spread over several pixels, masking the much weaker
echoes from the background. To reduce the sidelobes of the impulse
response, images are generally spectrally apodized, trading resolution for
a reduction of the sidelobes. This apodization procedure (global or shift-
variant) introduces spatial correlations in the speckle-dominated areas
which complicates the design of estimation methods. This paper describes
strategies to cancel sidelobes around point-like targets while preserving
the spatial resolution and the statistics of speckle-dominated areas. An
irregular sampling grid is built to compensate the sub-pixel shifts and
turn cardinal sines into discrete Diracs. A statistically grounded approach
for point-like target extraction is also introduced, thereby providing a
decomposition of a single look complex image into two components: a
speckle-dominated image and the point-like targets. This decomposition
can be exploited to produce images with improved quality (full resolution
and suppressed sidelobes) suitable both for visual inspection and further
processing (multi-temporal analysis, despeckling, interferometry).
Index Terms—SAR imaging, sub-pixel target detection, apodization,
sidelobe reduction, speckle, a contrario methodology.
I. INTRODUCTION
Synthetic aperture radar (SAR) images offer insight about the
back-scattering mechanisms at hand when radar pulses are emitted
towards a scene. In particular, two different types of mechanisms
generally occur: (i) man-made structures generate multiple bounces
that lead to both very high amplitude and well-localized echoes in the
SAR images; (ii) in vegetated areas, numerous echoes are produced,
these echoes interfere, leading to a speckle phenomenon. Hence, a
typical SAR image like the one shown in Fig. 1 (a) contains rather
homogeneous areas with fluctuations due to speckle phenomenon
(the larger the average intensity in the area, the larger are these
fluctuations) and the signature of man-made structures in the form of
intensities that are several orders of magnitude larger.
Visualization of such high dynamic range images requires clipping
values above some threshold (as done to produce Fig. 1 (a)). Because
the strongest echoes are several orders of magnitude more intense
than that of the surrounding areas, the impulse response of the
complete SAR imaging system (comprised of the SAR sensor and
the digital synthesis of the SAR image) is visible. A trade-off must
then be found between resolution preservation (limited widening of
the impulse response) and attenuation of the sidelobes of the impulse
response.
Images delivered by spatial agencies underwent a Fourier apodiza-
tion process to prevent the strongest echoes to spread over several tens
of pixels in a cross shape (the typical SAR impulse response without
apodization). Beyond a resolution loss, noticeable by the reduced
ability to separate two close-by echoes, this apodization impacts
regions dominated by speckle. While, without neither apodization
R
´
emy Abergel, Sa
¨
ıd Ladjal and Florence Tupin are with LTCI, T
´
el
´
ecom
ParisTech, 75013 Paris, France (e-mails: firstname.lastname@telecom-
paristech.fr). Lo
¨
ıc Denis is with the Univ Lyon, UJM-Saint-Etienne, Institut
d’Optique Graduate School, Laboratoire Hubert Curien CNRS UMR 5516,
F-42023 Saint-Etienne, France (e-mail: loic.denis@univ-st-etienne.fr).
nor oversampling, fluctuations within speckle-dominated regions are
statistically independent, apodization (and over-sampling) introduces
spatial correlations in these fluctuations. Visually, these fluctuations
appear grainy, but, more importantly, these correlations impact sta-
tistical methods for speckle reduction. Almost all these methods
assume that speckle is not spatially correlated [1]. Even methods
that are relatively immune to speckle correlation (e.g., NL-SAR
[2]) behave better in the absence of these correlations. Two options
are generally considered to handle speckle correlations: (i) sub-
sampling the apodized image to reduce the spatial correlations,
and (ii) speckle whitening, by processing the unapodized (and, if
necessary, resampled at Nyquist rate) image [3], similarly as done
in image processing to denoise images suffering from correlated
noise [4]. None of these two approaches is very satisfactory: the first
approach involves a resolution loss while the second, by removing
the apodization, reinforces the impulse response sidelobes so that the
resulting image is corrupted by large cross-shaped streaks around
brightest pixels.
Sidelobes reduction in SAR imagery has been the subject of
several works. Beyond apodization (i.e., linear processing by spectral
weighting), two main approaches have been proposed to improve
images with very strong echoes such as those created by ships or
buildings: nonlinear spatially variant apodization methods and target
extraction techniques.
The aim of spatially variant apodization methods is to reduce side-
lobes without sacrificing the spatial resolution, i.e., without widening
the main lobe. Nonlinear processing methods were introduced in [5]
under the name Spatially Variant Apodization (SVA) to reach this
goal. The starting point is the observation that, by non-linearly com-
bining impulse responses from a family of spectral weighting func-
tions (e.g., cosine-on-pedestal weighting functions that include Hann
and Hamming apodizations as special cases) an improved impulse
response can be obtained. All impulse responses are maximum at the
location of the target, they then differ in terms of sidelobes amplitude
(reduced when the apodization is stronger) and main lobe width
(narrowest in the absence of apodization). By retaining at each pixel
the smallest amplitude among all amplitudes obtained by applying the
family of apodization functions, sidelobes are kept minimum while
preventing the widening of the main lobe. The choice of cosine-on-
pedestal apodization functions leads to a very efficient algorithm that
can be applied in the signal domain as a space-variant finite impulse
response filter with very compact response [5]. Several extensions of
SVA were later introduced, in particular to perform super-resolution,
see e.g. [6]. We show in this paper that, despite its attractive
computational efficiency, SVA suffers from several drawbacks: (i) it
modifies the statistics of speckle-dominated areas, (ii) point-like
targets are still spread over several pixels, (iii) a negative bias is
introduced (homogeneous regions appear to have a lower reflectivity
after SVA processing). A somewhat related method for sidelobes
reduction, also based on a filter bank, has been investigated in [7].
Rather than locally selecting the best suited apodization, spectral
super-resolution techniques (Capon [8] or APES [9]) are applied
to improve the localization of point targets. These spectral super-
resolution techniques require an estimation of the signal covariance.

SUB-PIXELLIC METHODS FOR SIDELOBES SUPPRESSION AND STRONG TARGETS EXTRACTION IN SINGLE LOOK COMPLEX SAR IMAGES 2
After decomposition of the original SLC image into small patches
(typically 32 ×32), many sub-aperture images are generated for each
patch and the covariance is estimated based on these sub-aperture
images. A super-resolved patch is then produced and the final super-
resolved image is obtained by mosaicking all processed patches. This
method is computationally expansive but produces super-resolved
images with strongly reduced sidelobes provided that the signal
covariance can be correctly estimated and inverted. However, bright
targets are not explicitly detected nor extracted, speckle-corrupted
areas appear to be affected by the process (the super-resolution
introduces strong spatial correlations), and extended targets tend to
be thinned by the super-resolution process. This method is probably
not applicable as a general-purpose sidelobe reduction step prior to
subsequent automated processing.
The second approach to sidelobe reduction is based on the de-
tection of the strongest targets in order to extract them from the
SAR image. The residual image then contains speckle-dominated
regions that can be further processed, for example by a speckle
reduction method. This is the approach followed by [10] and some
other denoising methods, see the discussion in section V.C of [1].
Target detection in SAR images is an extensively studied topic.
In particular, many works are devoted to identifying weak targets
or moving targets [11]–[15], under foliage targets [16], using po-
larimetric data [17]–[19] or interferometric data [20], [21]. In the
context of image contamination by the sidelobes of strong targets,
the difficulty does not lie in the detection of the target (since the
signal-to-noise ratio is very high), but on the necessity to perform sub-
pixel localization of the target to correctly account for the sidelobes.
Detection techniques based on CLEAN algorithm [22]–[24] and its
extension RELAX [25] are then well-adapted. They process a SAR
image iteratively, detecting an additional target at each iteration
from the residuals obtained by subtracting already detected target
signatures from the SAR image. Each time a target is found, the
amplitude and sub-pixel location of the target are estimated in the
maximum likelihood sense, i.e., such that the residuals are minimized.
Decomposition models of a SAR image into strong scatterers
and homogeneous regions have been proposed [26], [27]. These
decomposition approaches however do not take into account the
sidelobes of strong scatterers (they apply to images that are apodized).
Contributions: this paper extends the recent conference pa-
per [28] and introduces:
(i) an irregular resampling procedure that suppresses sidelobes of
strong targets; this procedure preserves the statistical properties
of speckled areas and prevents from spreading bright targets,
(ii) a criterion based on the statistical framework of a contrario
methods to detect targets in speckle, with an explicit control
over the number of false alarms in the image,
(iii) a decomposition method that can separate a SAR image into two
components: one with speckle-dominated areas, the other with
all the strong targets; these components can be further processed
in order to reduce speckle or to improve the resolution.
The paper is organized as follows. Section II describes the spectral
apodization and oversampling that are typical in single look complex
(SLC) SAR images. Section III introduces a criterion to identify the
sub-pixel translation that would suppress at best the sidelobes. This
criterion is then applied to obtain an irregular resampling scheme that
produces images with strongly reduced sidelobes. Section IV derives
a target detection method. This method leads to a decomposition
scheme into a speckle-dominated component and a target compo-
nent whose efficiency and practical interest is illustrated in several
experiments.
(a) amplitude image |u| (b) Fourier modulus |bu|
Fig. 1. An example of TerraSAR-X image data. We display in (a) the
modulus of a SLC TerraSAR-X image u with size M × N (by convention in
all this work, the horizontal axis represents the range direction), and in (b) the
modulus of its DFT bu (low values are displayed in bright and high values are
displayed in dark). The Fourier spectrum (b) vanishes outside a rectangular
sub-frequency domain bω with size m × n (delimited by the red dashed line),
showing that the image u is oversampled by a factor M/m in the range
direction, and by a factor N/n in the azimuth direction.
II. PSEUDO-RAW IMAGE AND PSEUDO-RAW SPECTRUM
Let u : C be a SLC discrete image with size M × N and
spatial domain = I
M
× I
N
, noting I
K
= {0, . . . , K 1}. We
denote by bu the discrete Fourier transform (DFT) of u, which is the
two-dimensional and (M, N )-periodic complex-valued signal defined
by
(α, β) Z
2
, bu(α, β) =
X
(k,`)
u(k, `) e
2
(
M
+
N
)
. (1)
Generally, the study of bu is restricted to the period
b
=
b
I
M
×
b
I
N
,
noting
b
I
K
=
K
2
,
K
2
Z. The domain
b
is called the canonical
frequency domain (or reciprocal grid) associated to .
The SLC SAR images are, for reasons due to their acquisition
process, band-limited and well-sampled signals. This is illustrated
in Fig. 1, in which we display the modulus of a SLC TerraSAR-X
image u (Fig. 1 (a)) and the modulus of its DFT bu (Fig. 1 (b)).
Indeed, the restriction of bu to
b
is zero-valued everywhere outside
a rectangular frequency domain bω :=
b
I
m
×
b
I
n
b
of size m × n,
showing that the pixel spacing was adjusted during the sampling
process to (over) satisfy the Shannon-Nyquist criterion. Besides, and
as described in [29], the non-zero part of the Fourier spectrum is in
fact apodized, which means that for any (α, β)
b
, we have
bu(α, β) =
cu
0
(α, β) · γ(α, β) if (α, β) bω
0 otherwise,
(2)
where γ : bω R
+
\ {0} is a frequency attenuating function which
depends on the data provider, and we name cu
0
: bω C the pseudo-
raw spectrum. The complex-valued image u
0
: ω C with spatial
domain ω := I
m
×I
n
is hereafter called the pseudo-raw image. Since
the images u and u
0
have different pixel sizes, the pseudo-raw image
u
0
will always be compared to the subsampled image u
ω
: ω C
obtained by resampling u at the Nyquist frequency, i.e. the image
defined in the Fourier domain by
(α, β) bω, cu
ω
(α, β) =
|ω|
||
· bu(α, β) , (3)
where |ω| = m · n and || = M · N denote the cardinality of the
sets ω and .
In the particular case of TerraSAR-X [29], the apodization γ is,
up to a multiplicative factor a
γ
R that we introduce to ensure

SUB-PIXELLIC METHODS FOR SIDELOBES SUPPRESSION AND STRONG TARGETS EXTRACTION IN SINGLE LOOK COMPLEX SAR IMAGES 3
(a) apodized image u
ω
(b) pseudo-raw image u
0
oversampling of u
ω
oversampling of u
0
Fig. 2. Comparison between apodized and pseudo-raw images. On the
first row, we display the modulus of a portion of the apodized image u
ω
and the pseudo-raw image u
0
. Without apodization (pseudo-raw image u
0
),
the spatial resolution is higher but strong targets lead to sidelobes that mask
out the surrounding structures. The magnifications (zooming with factor ten
by Shannon interpolation) shown on the second row illustrate this trade-off
between widening of the central lobe and attenuation of the sidelobes (the
images are displayed using a common grayscale).
that both amplitude images |u
0
| and |u
ω
| have the same maximum,
a 2D-separable Hamming function,
(α, β) bω, γ(α, β) = a
γ
· γ
m
(α) · γ
n
(β) , where
γ
K
(ξ) = λ + (1 λ) cos
2πξ
K
, and λ = 0.6 , (4)
so that the unapodized pseudo-raw spectrum cu
0
can be easily
recovered from the initial spectrum bu by inverting (2). We refer the
reader to [3], [28] for more details about the computation of the
pseudo-raw image u
0
from u (in particular in the case when the
frequency attenuating function γ is unknown).
The reason why the spatial agencies introduce an apodization is
to attenuate the sidelobes of the strong point target responses (highly
present in urban areas) which are visible due to the SAR impulse
response. Indeed, an unresolved and isotropic target with constant
reflectivity over the radar electromagnetic band can be modeled after
the synthesis of the SAR image by a 2D separable cardinal sine
whose sidelobes remain particularly visible in the vicinity of the
target center, as we observe in Fig. 2 (b). Unfortunately, the reduction
of those sidelobes using apodization also results in a degradation of
the spatial resolution (see Fig. 2 (a)) and the choice of using the
Hamming apodization (4) in the case of TerraSAR-X is presented
in [29] as a trade-off between sidelobe reduction and deterioration of
the resolution.
III. AN IRREGULAR RESAMPLING SCHEME FOR COMPLEX
PSEUDO-RAW SAR IMAGES
In this section, we complete with more details and experimen-
tal results our previous work presented in [28], and we discuss
the strengths and weaknesses of the proposed irregular resampling
scheme.
A. The cardinal sine impulse response model
In stripmap mode, the SAR imaging system (acquisition + SAR
synthesis) exhibits an approximate separability in range and azimuth,
with rectangular spectra in both dimensions. Consequently, the im-
pulse response of the system is very well approached by a two-
dimensional product of cardinal sine functions,
(x, y) R
2
, sinc(x, y) =
sin (πx)
πx
·
sin (πy)
πy
, (5)
with the continuity preserving condition
sin (0)
0
= 1. Notice that
in (5), the coordinates (x, y) are scaled in order to set the range and
azimuth bandwidths both equal to 2π (i.e., the horizontal and vertical
dimensions of the spectrum support represented by the red-dashed
rectangle in Fig. 1 (b)). Under this model, the continuous signal
U
c
0
: R
2
C, before sampling, can be modeled as the convolution
between the continuous latent scene and the impulse response. It
follows that U
c
0
is a band-limited signal which can be reconstructed
exactly (neglecting sensor noise), according to the Shannon-Whittaker
Sampling Theorem [30], [31], provided an infinite number of its
samples {U
c
0
(k · δ
r
, ` · δ
az
)}
(k,`)Z
2
are observed at regularly spaced
locations, with steps δ
r
1 along the range direction and δ
az
1
along the azimuth direction. The pseudo-raw image u
0
corresponds to
the finite sampling of U
c
0
at the critical sampling step, δ
r
= δ
az
= 1,
while the initial image u corresponds to the sampling of U
c
0
using
the sub-critical steps δ
r
= m/M < 1 and δ
az
= n/N < 1. In the
following, we will denote by U
0
: R
2
C the Shannon interpolate
of u
0
(U
0
is different from U
c
0
since u
0
is made of only a finite
number of samples), which can be computed as U
0
= U
r
0
+ i · U
i
0
,
noting U
r
0
and U
i
0
the (real-valued) Shannon interpolates of the real
and imaginary parts of u
0
(see for instance Definition 2 in [32] for
the explicit interpolation formula).
In the rest of this section, we drop the double indexes for the spatial
coordinates in order to simplify the equations. The contribution to
the pseudo-raw image of an unresolved target (that is, a target with a
spatial extension that is negligible with respect to the SAR resolution)
located at sub-pixel location k
0
+ δ is:
k ω, u
0
(k) = A sinc(k (k
0
+ δ)) + u
0
(k) , (6)
where A C denotes target’s amplitude, k
0
ω, δ
1
2
,
1
2
2
, and
u
0
is the signal in the absence of the target. When δ 6= 0, the position
of the target center does not coincide with the sampling grid and for
large values of |A|, the signal u
0
is dominated by the oscillations of
the cardinal sine function in the vicinity of k
0
.
A straightforward solution to this problem consists in resampling
the image u
0
over a translated grid in which the coordinates of the
target center are integers, or equivalently, to translate the image u
0
by the sub-pixellic translation vector t = δ. Indeed, the translated
image is v
0
: k 7→ U
0
(k + δ) and satisfies
k ω, v
0
(k) = U
0
(k + δ) +
A if k = k
0
0 otherwise,
(7)
where U
0
denotes the Shannon interpolate of u
0
. The resampled
image v
0
is not anymore polluted by the cardinal sine oscillations
present in u
0
, and the image v
0
corresponds to a resampling of
u
0
, except at the position k = k
0
where the target appears. This
phenomenon is clearly illustrated on a portion of a TerraSAR-X
image in Fig. 3, where the profiles extracted from Fig. 3 (a) and
Fig. 3 (b) both correspond to a sampling over two translated grids of
the cardinal sine function. The noticeable difference between the two
sampling grids is that the one used for the blue-dotted line contains
the target center so that all the target energy is concentrated into a
single sample and the effects of the sidelobes are suppressed.
Unfortunately, when the image u
0
contains more than one target,
a global translation is in general not sufficient to accommodate all
the targets at the same time. For that reason, we introduced in [28]

SUB-PIXELLIC METHODS FOR SIDELOBES SUPPRESSION AND STRONG TARGETS EXTRACTION IN SINGLE LOOK COMPLEX SAR IMAGES 4
(a) pseudo-raw image (b) horizontal translation (c) 2D translation
814 816 818 820 822 824 826 828
horizontal axis (range)
-4000
-2000
0
2000
4000
6000
8000
10000
12000
14000
16000
real part of the pseudo-raw signal
cardinal sine function
horizontal section of (a)
horizontal section of (b)
Fig. 3. Profile of a strong target response at the sub-pixellic scale. We
display in (a) the modulus of the pseudo-raw image in the vicinity of a strong
target and we display in (b) and (c) the modulus of the pseudo-raw image
resampled over a translated grid, with translation vector t = (0.3, 0) and
t = (0.3, 0.1) respectively, yielding more localized target support. In the
second row, the real part of a range profile of (a) is represented by the red-
dashed line, while the corresponding profile in (b) is represented by the blue-
dotted line. The actual sampling of each curve is indicated using some colored
plus and cross marks. The green plain curve represents a pure cardinal sine
function of type x 7→ A
r
sinc(xx
0
), for some appropriate values of x
0
R
(sub-pixellic range coordinate of the target center) and A
r
R (real part of
the target amplitude). Some similar profiles are observed when we consider
the imaginary part of the signal, as well as when we extend the study to the
azimuth direction (as can be verified in (c)).
an irregular resampling scheme to locally reduce the influence of the
sidelobes of the strongest targets.
B. Irregular resampling scheme
The irregular resampling scheme consists in computing from the
pseudo-raw image u
0
a dense displacement field T = (T
x
, T
y
) :
ω
1
2
,
1
2
×
1
2
,
1
2
, that can be used to irregularly resample
u
0
into the image v
0
: ω C defined by
(k, `) ω , v
0
(k, `) = U
0
(k T
x
(k, `), ` T
y
(k, `)) . (8)
What we expect from the local displacement T is the following.
(i) In the vicinity of a strong target, the local displacement should
cancel the effects of the sidelobes.
(ii) The cancellation of the sidelobes should be as robust as possible
to target mixing situations.
(iii) In the regions where no strong target is present, the local
displacement field should preserve the speckle statistics, so that
posterior processings (such as denoising, segmentation, etc.)
remain possible using standard methods with no modification.
The two components T
x
and T
y
of the displacement field T will
be computed independently, which is motivated by the separability
in range and azimuth of the system’s impulse response, but also by
the drastic reduction of the algorithmic complexity that it offers. We
recall below how the computation of the displacement field in range
T
x
is done, that of T
y
being totally similar (by simply exchanging
the two coordinates).
Let K N denote a locality parameter and set ω = [K, K]Z.
For any position (k
0
, `
0
) ω, we will compute T
x
(k
0
, `
0
) using
T
x
(k
0
, `
0
) = argmin
1
2
t
1
2
J(U
0
(k
0
t + ω, `
0
)) , (9)
where J (defined below in (10)) is a cost function which is designed
to promote the choice of the best horizontal translation according
to (i), (ii) and (iii), and U
0
(k
0
t+ω, `
0
) is the mono-dimensional
discrete signal of size 2K+1 obtained by restricting the 2D periodical
signal U
0
: R
2
C to the discrete set (k
0
t + ω) × {`
0
}. The
cost function J is a variant of the discrete total variation operator,
whose role is to promote the choice of the translation yielding the
mono-dimensional discrete signal U
0
(k
0
t + ω, `
0
) that is the
least oscillatory (as is the case of the blue-dotted signal in Fig. 3,
which is much less oscillatory than the red-dashed one). It is defined
by
v : ω C , J(v) = TV
d
mask
(v
r
) + TV
d
mask
(v
i
) ,
where TV
d
mask
(s) =
X
Kp<K
p6∈{p
0
(s)1,p
0
(s)}
|s(p + 1) s(p)| , (10)
noting v
r
and v
i
the real and imaginary parts of v, and p
0
(s) the
position where |s| is maximal. The resulting irregular resampling
algorithm is given in the box titled Algorithm 1.
Algorithm 1: Irregular resampling scheme proposed in [28]
Inputs: a pseudo-raw image u
0
: ω C, a locality parameter
K, a number N
T
of tested translations such that the set of all
candidate (horizontal or vertical) translations is
T =
1
2
+
1
N
T
· {0, . . . , N
T
1}.
Outputs: a displacement field T = (T
x
, T
y
) : ω T × T and
the irregularly resampled pseudo-raw image v
0
: ω C that
corresponds to the resampling of u
0
over the irregular grid
ω T := {(k T
x
(k, `), ` T
y
(k, `), (k, `) ω}.
Initialization: precompute the horizontal and vertical
translations of u
0
, that is, compute for all t T,
u
x
t
= U
0
(ω (t, 0)) and u
y
t
= U
0
(ω (0, t)).
Iterations: for each (k, `) ω, compute T
x
(k, `), T
y
(k, `) and
v
0
(k, `) as follows
1
t
x
argmin
tT
J(u
x
t
(k + [K, K] Z, `))
t
y
argmin
tT
J(u
y
t
(k, ` + [K, K] Z))
T (k, `) (t
x
, t
y
)
v
0
(k, `) U
0
(k t
x
, ` t
y
)
(11a)
(11b)
(11c)
(11d)
1
In (11a) and (11b), we use a periodic convention for the images u
x
t
and u
y
t
when their evaluation outside of ω is needed. In (11d), the value U
0
(kt
x
, `
t
y
) can be efficiently computed by evaluating the Shannon interpolation of the
mono-dimensional signal ` 7→ u
x
t
x
(k, `) at the subpixellic position `t
y
(this
operation simply involves the inner product between the mono-dimensional
discrete signal and a cardinal sine function).
First, we illustrate the performance of this resampling method
in Fig. 4, where Algorithm 1 is used to resample two pseudo-raw
images: a satellite image (TerraSAR-X in stripmap mode, copyright
DLR, LAN-1706 project acquired on the region Auvergne-Rh
ˆ
one-
Alpes, South of France) and an airborne image (RAMSES sensor,
ONERA). We show on this experiment that the spatial resolution is
preserved by the resampling procedure while suppressing sidelobes
that were visible in the unapodized image.
When the complex amplitude in a given resolution cell results from
the interferences from several echoes of comparable amplitude, strong
intensity fluctuations are observed in the SAR image (the so-called
speckle phenomenon [33]). If several acquisitions of the same scene
are available, the speckle can be reduced by temporal averaging (a.k.a.
multi-looking). More precisely, if {a
k
}
1kN
looks
is a sequence of
N
looks
complex-valued images, the associated multi-look image is the
real-valued image a
ML
= (1/N
looks
·
P
N
looks
k=1
|a
k
|
2
)
0.5
. In Fig. 5, we
compare the multi-look image computed from an apodized sequence

Citations
More filters
01 May 1995
TL;DR: In this article, a comprehensive comparison of 2D spectral estimation methods for SAR imaging is presented, and a theoretical analysis of the impact of the adaptive sidelobe reduction (ASR) algorithm on target to clutter ratio is provided.
Abstract: : This report discusses the use of modern 2-D spectral estimation algorithms for SAR imaging, and makes two principal contributions to the field of adaptive SAR imaging. First, it is a comprehensive comparison of 2-D spectral estimation methods for SAR imaging. It provides a synopsis of the algorithms available, discusses their relative merits for SAR imaging, and illustrates their performance on simulated and collected SAR imagery. The discussion of autoregressive linear predictive techniques (ARLP), including the Tufts Kumaresan variant, is somewhat more general than appears in most of the literature, in that it allows the prediction element to be varied throughout the subaperture. This generality leads to a theoretical link between ARLP and one of Pisarenko's methods. The report also provides a theoretical analysis that predicts the impact of the adaptive sidelobe reduction (ASR) algorithm on target to clutter ratio and provides insight into order and constraint selection. Second, this work develops multi-channel variants of three related algorithms, minimum variance method (MVM), reduced rank MVM (RRMVM), and ASR to estimate both reflectivity intensity and interferometric height from polarimetric displaced-aperture interferometric data. Examples illustrate that MVM and ASR both offer significant advantages over Fourier methods for estimating both scattering intensity and interferometric height, and allow empirical comparison of the accuracies of Fourier, MVM, and- ometric height estimates.

226 citations

Journal ArticleDOI
TL;DR: The proposed ratio-based Denoising framework successfully extends single-image SAR denoising methods to time series by exploiting the persistence of many geometrical structures.
Abstract: In this paper, we propose a fast and efficient multitemporal despeckling method. The key idea of the proposed approach is the use of the ratio image, provided by the ratio between an image and the temporal mean of the stack. This ratio image is easier to denoise than a single image thanks to its improved stationarity. Besides, temporally stable thin structures are well preserved thanks to the multitemporal mean. The proposed approach can be divided into three steps: 1) estimation of a “superimage” by temporal averaging and possibly spatial denoising; 2) denoising of the ratio between the noisy image of interest and the “superimage”; and 3) computation of the denoised image by remultiplying the denoised ratio by the “superimage.” Because of the improved spatial stationarity of the ratio images, denoising these ratio images with a speckle-reduction method is more effective than denoising images from the original multitemporal stack. The amount of data that is jointly processed is also reduced compared to other methods through the use of the “superimage” that sums up the temporal stack. The comparison with several state-of-the-art reference methods shows better results numerically (peak signal-noise-ratio and structure similarity index) as well as visually on simulated and synthetic aperture radar (SAR) time series. The proposed ratio-based denoising framework successfully extends single-image SAR denoising methods to time series by exploiting the persistence of many geometrical structures.

72 citations


Cites methods from "Subpixellic Methods for Sidelobes S..."

  • ...In this paper, the noisy TerraSAR-X images are decorrelated using the method proposed in [40] and the Sentinel-1 images are decorrelated by resampling because of its special acquisition model (the beam both steering in range direction and steering from backward to forward in azimuth direction)....

    [...]

Journal ArticleDOI
TL;DR: A deep learning algorithm with semi-supervision is proposed in this article: SAR2SAR, where Multitemporal time series are leveraged and the neural network learns to restore SAR images by only looking at noisy acquisitions.
Abstract: Speckle reduction is a key step in many remote sensing applications By strongly affecting synthetic aperture radar (SAR) images, it makes them difficult to analyze Due to the difficulty to model the spatial correlation of speckle, a deep learning algorithm with semi-supervision is proposed in this article: SAR2SAR Multitemporal time series are leveraged and the neural network learns to restore SAR images by only looking at noisy acquisitions To this purpose, the recently proposed noise2noise framework [1] has been employed The strategy to adapt it to SAR despeckling is presented, based on a compensation of temporal changes and a loss function adapted to the statistics of speckle A study with synthetic speckle noise is presented to compare the performances of the proposed method with other state-of-the-art filters Then, results on real images are discussed, to show the potential of the proposed algorithm The code is made available to allow testing and reproducible research in this field

57 citations


Cites background from "Subpixellic Methods for Sidelobes S..."

  • ...Whitening the spectrum [18], [25] or down-sampling the image...

    [...]

  • ...man’s fully developed speckle model generally assume an absence of spatial correlations [17], which is not the case in actual SAR images synthetized by space agencies [18], [24]....

    [...]

Journal ArticleDOI
TL;DR: In this article, a CNN model is applied to remove additive white Gaussian noise from natural images, and a hybrid approach is also analyzed: the CNN is trained on speckle-free SAR images, which are used to evaluate the quality of denoising and discuss the pros and cons of the different strategies.
Abstract: Speckle reduction is a longstanding topic in synthetic aperture radar (SAR) images. Many different schemes have been proposed for the restoration of intensity SAR images. Among the different possible approaches, methods based on convolutional neural networks (CNNs) have recently shown to reach state-of-the-art performance for SAR image restoration. CNN training requires good training data: many pairs of speckle-free/speckle-corrupted images. This is an issue in SAR applications, given the inherent scarcity of speckle-free images. To handle this problem, this paper analyzes different strategies one can adopt, depending on the speckle removal task one wishes to perform and the availability of multitemporal stacks of SAR data. The first strategy applies a CNN model, trained to remove additive white Gaussian noise from natural images, to a recently proposed SAR speckle removal framework: MuLoG (MUlti-channel LOgarithm with Gaussian denoising). No training on SAR images is performed, the network is readily applied to speckle reduction tasks. The second strategy considers a novel approach to construct a reliable dataset of speckle-free SAR images necessary to train a CNN model. Finally, a hybrid approach is also analyzed: the CNN used to remove additive white Gaussian noise is trained on speckle-free SAR images. The proposed methods are compared to other state-of-the-art speckle removal filters, to evaluate the quality of denoising and to discuss the pros and cons of the different strategies. Along with the paper, we make available the weights of the trained network to allow its usage by other researchers.

33 citations

Journal ArticleDOI
TL;DR: Simulation results showed a steady improvement of performance scores, most notably the equivalent number of looks (ENL), which increased after decorrelation and closely attained the value of the uncorrelated case, whose estimation accuracy is diminished by the correlation.
Abstract: In this work, we extended a procedure for the spatial decorrelation of fully-developed speckle, originally developed for single-polarization SAR data, to fully-polarimetric SAR data. The spatial correlation of the noise depends on the tapering window in the Fourier domain used by the SAR processor to avoid defocusing of targets caused by Gibbs effects. Since each polarimetric channel is focused independently of the others, the noise-whitening procedure can be performed applying the decorrelation stage to each channel separately. Equivalently, the noise-whitening stage is applied to each element of the scattering matrix before any multilooking operation, either coherent or not, is performed. In order to evaluate the impact of a spatial decorrelation of the noise on the performance of polarimetric despeckling filters, we make use of simulated PolSAR data, having user-defined polarimetric features. We optionally introduce a spatial correlation of the noise in the simulated complex data by means of a 2D separable Hamming window in the Fourier domain. Then, we remove such a correlation by using the whitening procedure and compare the accuracy of both despeckling and polarimetric features estimation for the three following cases: uncorrelated, correlated, and decorrelated images. Simulation results showed a steady improvement of performance scores, most notably the equivalent number of looks (ENL), which increased after decorrelation and closely attained the value of the uncorrelated case. Besides ENL, the benefits of the noise decorrelation hold also for polarimetric features, whose estimation accuracy is diminished by the correlation. Also, the trends of simulations were confirmed by qualitative results of experiments carried out on a true Radarsat-2 image.

17 citations


Cites methods from "Subpixellic Methods for Sidelobes S..."

  • ...For instance, a tailored procedure, decomposing single-polarization SAR imagery in speckle dominated areas and point targets, was proposed in [33]....

    [...]

References
More filters
Journal ArticleDOI
TL;DR: The authors introduce an algorithm, called matching pursuit, that decomposes any signal into a linear expansion of waveforms that are selected from a redundant dictionary of functions, chosen in order to best match the signal structures.
Abstract: The authors introduce an algorithm, called matching pursuit, that decomposes any signal into a linear expansion of waveforms that are selected from a redundant dictionary of functions. These waveforms are chosen in order to best match the signal structures. Matching pursuits are general procedures to compute adaptive signal representations. With a dictionary of Gabor functions a matching pursuit defines an adaptive time-frequency transform. They derive a signal energy distribution in the time-frequency plane, which does not include interference terms, unlike Wigner and Cohen class distributions. A matching pursuit isolates the signal structures that are coherent with respect to a given dictionary. An application to pattern extraction from noisy signals is described. They compare a matching pursuit decomposition with a signal expansion over an optimized wavepacket orthonormal basis, selected with the algorithm of Coifman and Wickerhauser see (IEEE Trans. Informat. Theory, vol. 38, Mar. 1992). >

9,380 citations


"Subpixellic Methods for Sidelobes S..." refers methods in this paper

  • ...Under that viewpoint, the CLEAN algorithm corresponds to the mere matching pursuit [37] while the RELAX algorithm is closer to the orthogonal matching pursuit [38]....

    [...]

Journal ArticleDOI
Claude E. Shannon1
01 Jan 1949
TL;DR: A method is developed for representing any communication system geometrically and a number of results in communication theory are deduced concerning expansion and compression of bandwidth and the threshold effect.
Abstract: A method is developed for representing any communication system geometrically Messages and the corresponding signals are points in two "function spaces," and the modulation process is a mapping of one space into the other Using this representation, a number of results in communication theory are deduced concerning expansion and compression of bandwidth and the threshold effect Formulas are found for the maximum rate of transmission of binary digits over a system when the signal is perturbed by various types of noise Some of the properties of "ideal" systems which transmit at this maximum rate are discussed The equivalent number of binary digits per second for certain information sources is calculated

6,712 citations


"Subpixellic Methods for Sidelobes S..." refers background in this paper

  • ...It follows that Uc0 is a band-limited signal which can be reconstructed exactly (neglecting sensor noise), according to the Shannon-Whittaker Sampling Theorem [30], [31], provided an infinite number of its samples {Uc0 (k · δr, ` · δaz)}(k,`)∈Z2 are observed at regularly spaced locations, with steps δr ≤ 1 along the range direction and δaz ≤ 1 along the azimuth direction....

    [...]

  • ...Sampling Theorem [30], [31], provided an infinite number of its samples {U 0 (k · δr, ` · δaz)}(k,`)∈Z2 are observed at regularly spaced locations, with steps δr ≤ 1 along the range direction and δaz ≤ 1 along the azimuth direction....

    [...]

Journal ArticleDOI
01 Aug 1969
TL;DR: In this article, a high-resolution frequency-wavenumber power spectral density estimation method was proposed, which employs a wavenumber window whose shape changes and is a function of the wave height at which an estimate is obtained.
Abstract: The output of an array of sansors is considered to be a homogeneous random field. In this case there is a spectral representation for this field, similar to that for stationary random processes, which consists of a superposition of traveling waves. The frequency-wavenumber power spectral density provides the mean-square value for the amplitudes of these waves and is of considerable importance in the analysis of propagating waves by means of an array of sensors. The conventional method of frequency-wavenumber power spectral density estimation uses a fixed-wavenumber window and its resolution is determined essentially by the beam pattern of the array of sensors. A high-resolution method of estimation is introduced which employs a wavenumber window whose shape changes and is a function of the wavenumber at which an estimate is obtained. It is shown that the wavenumber resolution of this method is considerably better than that of the conventional method. Application of these results is given to seismic data obtained from the large aperture seismic array located in eastern Montana. In addition, the application of the high-resolution method to other areas, such as radar, sonar, and radio astronomy, is indicated.

5,415 citations


"Subpixellic Methods for Sidelobes S..." refers methods in this paper

  • ...Rather than locally selecting the best suited apodization, spectral super-resolution techniques (Capon [8] or APES [9]) are applied to improve the localization of point targets....

    [...]

Proceedings ArticleDOI
01 Nov 1993
TL;DR: A modification to the matching pursuit algorithm of Mallat and Zhang (1992) that maintains full backward orthogonality of the residual at every step and thereby leads to improved convergence is proposed.
Abstract: We describe a recursive algorithm to compute representations of functions with respect to nonorthogonal and possibly overcomplete dictionaries of elementary building blocks e.g. affine (wavelet) frames. We propose a modification to the matching pursuit algorithm of Mallat and Zhang (1992) that maintains full backward orthogonality of the residual (error) at every step and thereby leads to improved convergence. We refer to this modified algorithm as orthogonal matching pursuit (OMP). It is shown that all additional computation required for the OMP algorithm may be performed recursively. >

4,607 citations


"Subpixellic Methods for Sidelobes S..." refers methods in this paper

  • ...Under that viewpoint, the CLEAN algorithm corresponds to the mere matching pursuit [37] while the RELAX algorithm is closer to the orthogonal matching pursuit [38]....

    [...]

Journal ArticleDOI
TL;DR: The authors present a complete procedure for the identification and exploitation of stable natural reflectors or permanent scatterers (PSs) starting from long temporal series of interferometric SAR images.
Abstract: Temporal and geometrical decorrelation often prevents SAR interferometry from being an operational tool for surface deformation monitoring and topographic profile reconstruction. Moreover, atmospheric disturbances can strongly compromise the accuracy of the results. The authors present a complete procedure for the identification and exploitation of stable natural reflectors or permanent scatterers (PSs) starting from long temporal series of interferometric SAR images. When, as it often happens, the dimension of the PS is smaller than the resolution cell, the coherence is good even for interferograms with baselines larger than the decorrelation one, and all the available images of the ESA ERS data set can be successfully exploited. On these pixels, submeter DEM accuracy and millimetric terrain motion detection can be achieved, since atmospheric phase screen (APS) contributions can be estimated and removed. Examples are then shown of small motion measurements, DEM refinement, and APS estimation and removal in the case of a sliding area in Ancona, Italy. ERS data have been used.

3,963 citations


"Subpixellic Methods for Sidelobes S..." refers background in this paper

  • ...In particular, many works are devoted to identifying weak targets or moving targets [11]–[15], under foliage targets [16], using polarimetric data [17]–[19] or interferometric data [20], [21]....

    [...]

Frequently Asked Questions (8)
Q1. What contributions have the authors mentioned in the paper "Sub-pixellic methods for sidelobes suppression and strong targets extraction in single look complex sar images" ?

This apodization procedure ( global or shiftvariant ) introduces spatial correlations in the speckle-dominated areas which complicates the design of estimation methods. This paper describes strategies to cancel sidelobes around point-like targets while preserving the spatial resolution and the statistics of speckle-dominated areas. This decomposition can be exploited to produce images with improved quality ( full resolution and suppressed sidelobes ) suitable both for visual inspection and further processing ( multi-temporal analysis, despeckling, interferometry ). 

It would be also interesting to investigate the possibility to design SAR image processing models that would rely on the two components jointly. 

Their revisited CLEAN procedure relies on an efficient sub-pixellic target detection criterion based on the so-called a contrario methodology [43], which leads to a well justified stopping criterion and an accurate control of the false alarms. 

Initialization: precompute the horizontal and vertical translations of u0, that is, compute for all t ∈ T, uxt = U0(ω − (t, 0)) and uyt = U0(ω − (0, t)). 

Compared to the classical statistical decision theory, the a contrario framework presents the advantage to get rid of the design of a H1 hypothesis, making the a contrario algorithm less sensitive to the modeling choice for the structures that the authors want to detect. 

C the recombination of C into discrete Diracs on the grid ω′, which is defined by∀(x′, y′) ∈ ω′, Dω′(C )(x′, y′) = ∑(x,y,A)∈CAδπω′ (x,y)(x ′, y′) , (22)where πω′(x, y) = argmin(x′,y′)∈ω′ ‖(x − x′, y − y′)‖ denotes a projection of (x, y) over ω′, and δπω′ (x,y)(x ′, y′) is defined by∀(x′, y′) ∈ ω′ , δπω′ (x,y)(x ′, y′) = { 1 if (x′, y′) = πω′(x, y) 0 otherwise,so that δπω′ (x,y) simply represents a discrete Dirac centered at the position πω′(x, y) ∈ ω′. 

due to the sampling, the total amplitude of the target can be smeared in the vicinity of its center (this is the sidelobe effect) which makes difficult the estimation of the reflectivity of its surrounding area. 

Under this model, the continuous signal Uc0 : R2 → C, before sampling, can be modeled as the convolution between the continuous latent scene and the impulse response.