All figures (9)
 Figure 9. Microphotographs of wear. Bars indicate scale. (a) Wear track on PTFE coating created by steel ball. (b) Wear track of steel on steel. (c) Wear and debris on a steel ball after sliding on sapphire. (d) Wear cracks and debris on sapphire ball after sliding on a sapphire plate.
 Figure 1. Schematic diagram showing copper slider supported on ball bearings which slides on replaceable plates that form a 90 degree vee track. The mu metal button is used in conjunction with the solenoid to provide thermal contact to the copper slider and to control the release of the slider at high inclination angles.
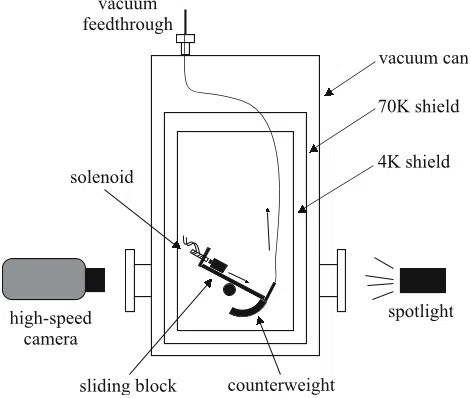
 Figure 2. Schematic diagram of the cryostat and sliding block tribometer. The vee-shaped track can be rotated around a horizontal axis by pulling against a counterweight with a thin flexible wire attached to a vacuum feedthrough. In the actual experiment, the camera and the light source were collinear with the axis of rotation.
 Figure 4. Displacement of the block parallel to the track as a function of time. Open circles are the position determined from the video frames. The solid curve is a least squares fit of a quadratic polynomial. The coefficient of the quadratic term is directly related to the acceleration.
 Figure 3. Free body diagram showing the total forces on the sliding block. The factors of ffiffiffi 2 p are due to fact that the load bearing faces of the block are inclined at an angle of 45 , as shown in figure 1. The total normal force is made up of the sum of the normal force exerted by each face of the vee: mgcosð Þ ffiffiffi 2 p þmgcosð Þ ffiffiffi 2 p ¼ ffiffiffi 2 p mgcosð Þ.
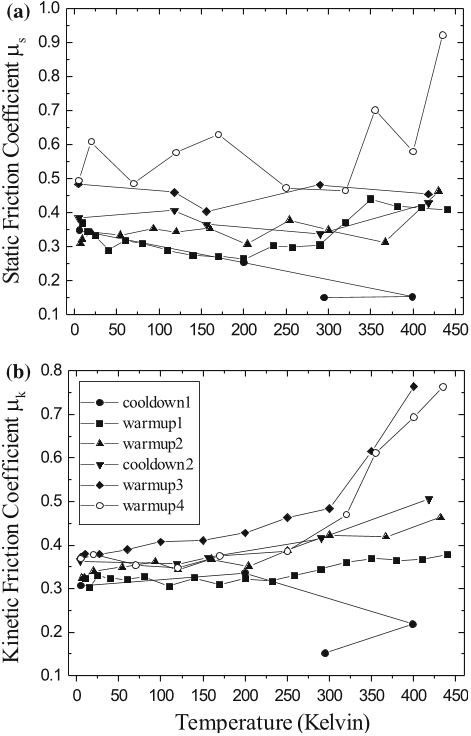 Figure 5. Friction coefficients of stainless steel on stainless steel as a function of temperature. The symbols indicate whether the data was taken on heating or cooling, and the line segments connecting the data points indicate the order in which they were measured. (a) static friction, (b) sliding friction.
 Figure 6. Friction coefficients of stainless steel on sapphire as a function of temperature. The symbols indicate whether the data was taken on heating or cooling, and the line segments connecting the data points indicate the order in which they were measured. (a) static friction, (b) sliding friction.
 Figure 8. Friction coefficients of steel on PTFE (Teflon) coating as a function of temperature. The symbols indicate whether the data was taken on heating or cooling, and the line segments connecting the data points indicate the order in which they were measured. (a) static friction, (b) sliding friction.
 Figure 7. Friction coefficients of sapphire on sapphire as a function of temperature. The symbols indicate whether the data was taken on heating or cooling, and the line segments connecting the data points indicate the order in which they were measured. (a) static friction, (b) sliding friction.