
All figures (13)
 Figure 1: Diagram illustrating the experimental procedures.
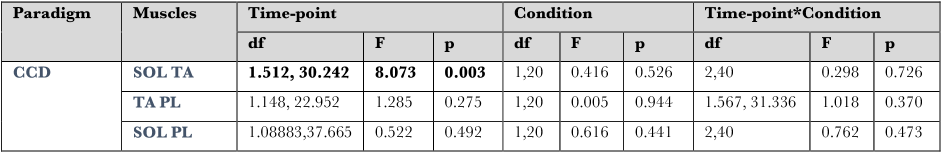 Table 1: Results of repeated-measures ANOVA of the duration of co-contraction of three muscle pairs, in perturbed and unperturbed standing at three Time-points of Pre, Post1 and Post2. Bold numbers indicate a significant effect.
 Figure 6: Co-contraction index at three time-points in a) perturbed and b) unperturbed standing, for the muscle pairs SOL/TA. Circles and connecting lines represent individual results. The red lines indicate averages across subjects.
 Figure 2: Participant in unipedal stance on the robot-controlled balance platform. This article is a part of a larger study, EEG data will be reported later.
 Figure 5: The mean absolute center of mass velocity in mediolateral direction at all three measured time-points a) in the perturbed condition b) in the unperturbed condition c) in H-reflex bipedal stance condition d) in H-reflex unipedal stance condition. Circles and connecting lines represent individual results. The red lines indicate averages across subjects.
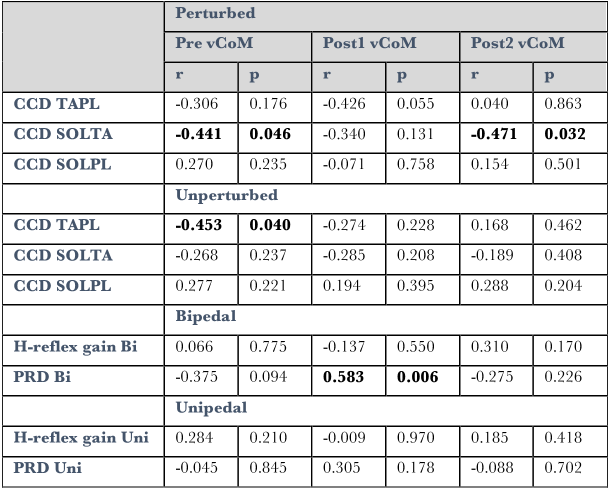 Table 4: Results of the correlational analysis between co-contraction with vCoM in perturbed and unperturbed, and between reflexes in bipedal and unipedal with vCoM in bipedal and unipedal stance at each Time-points of Pre, Post1 and Post2. Bold numbers indicate a significant effect.
 Table 5: Results of the correlational analysis between changes of co-contraction with changes of vCoM in perturbed and unperturbed, and changes of reflexes in bipedal and unipedal with changes of vCoM in bipedal and unipedal stance after one session and ten sessions of training
![Figure 3: The duration of balancing in [s], and corresponding stiffness as a function of mgh (body mass times gravity times the height of the body center of mass) and time.](/figures/figure-3-the-duration-of-balancing-in-s-and-corresponding-370keak4.png) Figure 3: The duration of balancing in [s], and corresponding stiffness as a function of mgh (body mass times gravity times the height of the body center of mass) and time.
Figure 3: The duration of balancing in [s], and corresponding stiffness as a function of mgh (body mass times gravity times the height of the body center of mass) and time. Table 2: Results of the correlational analysis between co-contraction (averaged over perturbed and unperturbed trials), reflexes in bipedal and unipedal with balance robustness (duration) at each Time-point. Bold numbers indicate a significant effect.
 Table 3: Results of the correlational analysis between the changes of co-contraction (averaged over perturbed and unperturbed trials), changes of reflexes in bipedal and unipedal with changes of balance robustness (duration) after one session and ten sessions of training.
 Figure 4: Balance robustness at different time-points, expressed as the duration of maintaining balance under gradually decreasing surface stiffness.
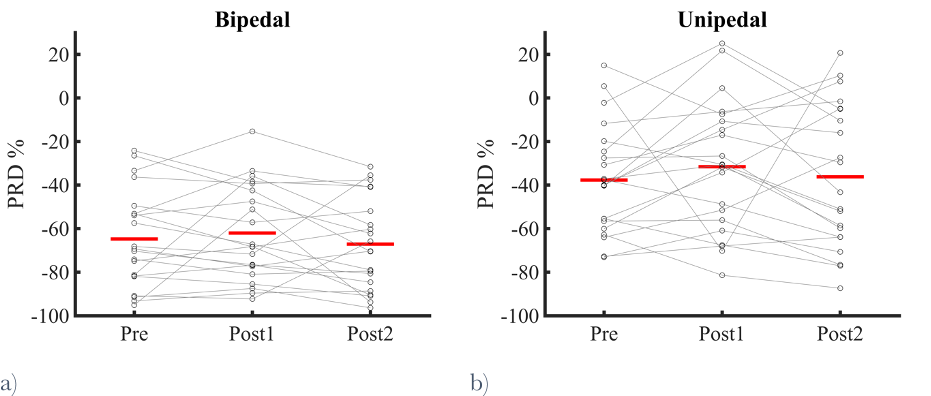 Figure 8: Paired reflex depression at three time-points. The paired reflex depression is displayed for a) the bipedal condition, and b) unipedal condition. Circles and connecting lines represent individual results. The red lines indicate averages across subjects.
 Figure 7: H-reflex gains at three time-points a) shows the reflex gain for the bipedal condition b) shows the reflex gain for the unipedal condition. Circles and connecting lines represent individual results. The red lines indicate averages across subjects.


![Figure 3: The duration of balancing in [s], and corresponding stiffness as a function of mgh (body mass times gravity times the height of the body center of mass) and time.](/figures/figure-3-the-duration-of-balancing-in-s-and-corresponding-370keak4.webp)


