
All figures (10)
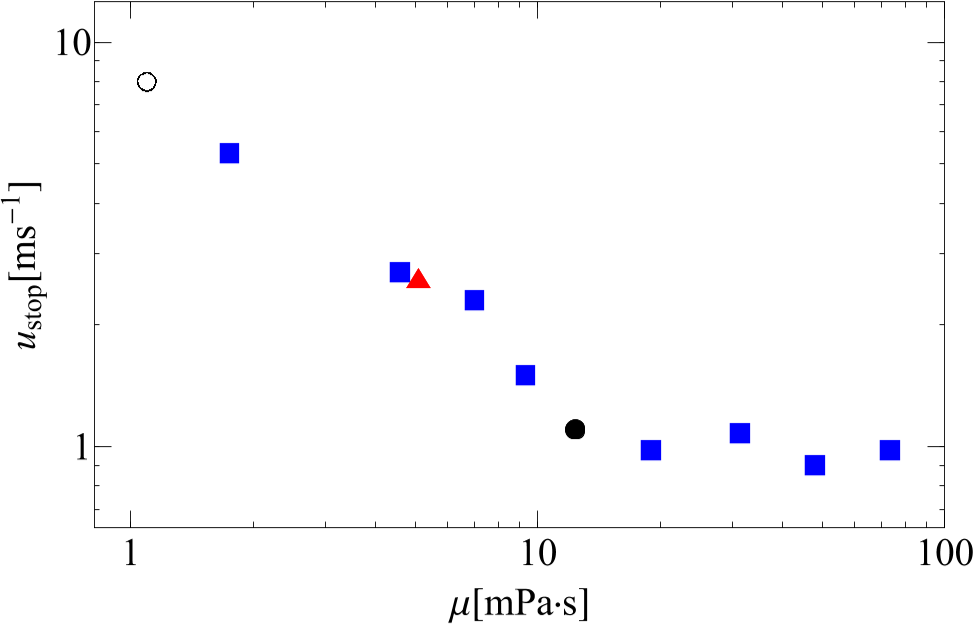 Figure 4.3: A log-log plot of the threshold velocity ustop vs. liquid viscosity µL for D = 3.3mm drops impacting a glass slide at 3.4m s in an atmosphere of air. Various liquids were used: ethanol ( ), silicone oil ( ), a solution of ethanol, water and sucrose ( ), and a solution of water and glycerol ( ).
![Figure 3.2: Interference images of 9.4mPa s silicone oil drops of radiusR = 1.65mm impacting a glass slide with velocity of 2.2m s−1 as seen from below. The images were taken at t = 0.08, 0.18, 0.24, and 0.46ms after impact and at three different pressures, which were chosen to illustrate the transition in Fig. 3.1: P = 55kPa below the transition pressure, 58kPa in the transition region, and 70kPa above the transition pressure. At the earliest time the image of the spreading liquid is black, indicating that it is in contact with the glass. A trapped air bubble can be seen trapped at the center of each impact [15]. At t = 0.18ms an interference pattern is seen at the edge of the 70kPa drop, indicating that the liquid is now spreading over a thin air gap and that a thin sheet has been created. The air gap is also seen in parts of the liquid edge at 58kPa. At t = 0.24ms the interference patterns grow for both the 58kPa and the 70kPa drops. In the 58kPa images, the regions of the spreading drop that had not already formed a thin sheet remain on the substrate and do not form a thin sheet until a later time. At t = 0.46ms an air gap has finally developed for the 55kPa drop, as well as the remaining regions of the 58kPa case. Close inspection reveals that the liquid locally bridges the air gap near the contact line, as described in [6]. The white scale bar is equivalent to 3.3mm, the diameter of the original drop.](/figures/figure-3-2-interference-images-of-9-4mpa-s-silicone-oil-1060imm8.png) Figure 3.2: Interference images of 9.4mPa s silicone oil drops of radiusR = 1.65mm impacting a glass slide with velocity of 2.2m s−1 as seen from below. The images were taken at t = 0.08, 0.18, 0.24, and 0.46ms after impact and at three different pressures, which were chosen to illustrate the transition in Fig. 3.1: P = 55kPa below the transition pressure, 58kPa in the transition region, and 70kPa above the transition pressure. At the earliest time the image of the spreading liquid is black, indicating that it is in contact with the glass. A trapped air bubble can be seen trapped at the center of each impact [15]. At t = 0.18ms an interference pattern is seen at the edge of the 70kPa drop, indicating that the liquid is now spreading over a thin air gap and that a thin sheet has been created. The air gap is also seen in parts of the liquid edge at 58kPa. At t = 0.24ms the interference patterns grow for both the 58kPa and the 70kPa drops. In the 58kPa images, the regions of the spreading drop that had not already formed a thin sheet remain on the substrate and do not form a thin sheet until a later time. At t = 0.46ms an air gap has finally developed for the 55kPa drop, as well as the remaining regions of the 58kPa case. Close inspection reveals that the liquid locally bridges the air gap near the contact line, as described in [6]. The white scale bar is equivalent to 3.3mm, the diameter of the original drop.
Figure 3.2: Interference images of 9.4mPa s silicone oil drops of radiusR = 1.65mm impacting a glass slide with velocity of 2.2m s−1 as seen from below. The images were taken at t = 0.08, 0.18, 0.24, and 0.46ms after impact and at three different pressures, which were chosen to illustrate the transition in Fig. 3.1: P = 55kPa below the transition pressure, 58kPa in the transition region, and 70kPa above the transition pressure. At the earliest time the image of the spreading liquid is black, indicating that it is in contact with the glass. A trapped air bubble can be seen trapped at the center of each impact [15]. At t = 0.18ms an interference pattern is seen at the edge of the 70kPa drop, indicating that the liquid is now spreading over a thin air gap and that a thin sheet has been created. The air gap is also seen in parts of the liquid edge at 58kPa. At t = 0.24ms the interference patterns grow for both the 58kPa and the 70kPa drops. In the 58kPa images, the regions of the spreading drop that had not already formed a thin sheet remain on the substrate and do not form a thin sheet until a later time. At t = 0.46ms an air gap has finally developed for the 55kPa drop, as well as the remaining regions of the 58kPa case. Close inspection reveals that the liquid locally bridges the air gap near the contact line, as described in [6]. The white scale bar is equivalent to 3.3mm, the diameter of the original drop. Figure 4.1: The velocity of the spreading liquid at the splashing onset usheet (open symbols) and the threshold velocity ustop (closed symbols) vs. ambient pressure for R = 3.2mm silicone oil drops of viscosity 9.4mPa s ( ), 19mPa s ( ), and 48mPa s ( ) impacting a glass slide at 3.4m s−1. While usheet decreases with pressure, ustop remains approximately constant. The threshold pressures Psheet, marked by dashed lines of the respective color, are set by the crossover of usheet (P ) and ustop.
 Figure 1.1: Successive images of a 9.4mPa s silicone oil drop of diameter D = 3.3mm impacting a glass slide at V = 3.4m s−1 (Re = 1100, We = 1600) at atmospheric pressure. Images (a)-(d) show the drop splashing on a smooth glass slide at times t = 0.18, 0.33, 1.2 and 2.3ms. The red arrow in (b) points to the newly-created thin sheet that grows in subsequent images. Images (e)-(f) show the corresponding frames of a drop impacting a slide that is comprised of a rough (right, dark) and a smooth (left, bright) region. Thin-sheet formation and splashing take place only in the smooth region.
 Figure 3.1: Sheet creation time vs. pressure for 9.4mPa s silicone oil drops of radius R = 1.65m s−1 impacting a glass slide with velocity 1.4m s−1 ( ), 2.2m s−1 ( ), and 3.4m s−1 ( ). The increase in tsheet with decreasing pressure is smooth for both the fastest and the slowest drops. In contrast, a transition in tsheet is seen at P = 58 ± 1kPa for the intermediate velocity drop. Above the transition the sheet creation time slowly increases from 0.06ms to 0.12ms as pressure is reduced from 100kPa to 60kPa. As the pressure is further reduced to 57kPa, tsheet more than doubles to 0.27ms. The distribution of tsheet is bimodal in this region, with sheet creation times clustered around either 0.12ms or 0.27ms. As pressure is reduced further, tsheet increases smoothly. The inset shows the transition region in detail. Lines are guides to the eye.
 Figure 3.4: Diagram of drop impact outcomes for 9.4mPa s silicone oil drops of radius R = 1.65mm as gas pressure and impact velocity are varied: small-r∗ sheet (red), large-r∗ sheet (blue), and no sheet (white). (Data was not taken below V = 1m s−1, therefore that region is left blank.) The boundaries between the regions are Psmall-r∗ ( ) and Plarge-r∗ ( ). The smaller of the thresholds at a given V determines Psheet (filled symbols). If Psmall-r∗ > Plarge-r∗ , Psmall-r∗ marks the transition between a small-r ∗ and a large-r∗ sheet (empty symbols), as shown in Fig. 3.1. The lines serve as a guide to the eye.
 Figure 3.5: Threshold pressures of small-r∗ and large-r∗ sheets for silicone oil drops of viscosity 9.4mPa s and radius R = 0.85mm ( ), 1.20mm ( ), 1.65mm ( ), and 4.6mPa s drops of radius 1.65mm ( ). The open symbols represent the transition between the smallr∗ and large-r∗ sheets. The data is scaled by R0.5.
 Figure 4.4: Threshold velocity ustop vs. impact velocity for for 9.4mPa s silicone oil drops of radius 1.6mm ( ). A discontinuous transition separates a regime where ustop is dependent on a low impact velocity and one where ustop is independent of high impact velocities. The two regimes correspond to the small-r∗ and large-r∗ sheets. The dashed lines are a guide to the eye. Inset: ustop vs. V scaled by
 Figure 4.2: The velocity of the advancing liquid at the splashing onset usheet vs. gas pressure for D = 3.3mm silicone oil drops of viscosity 4.6mPa s impacting a smooth glass slide at 3.5m s−1 in an atmosphere of air, neon, and helium. The dashed line marks ustop = 2.6m s−1. For each gas, the leftmost points represent the measured Psheet.
 Figure 3.3: The radius of region wetted by the drop at tsheet rescaled by drop radius, r ∗ vs. pressure for 9.4mPa s silicone oil drops of radius R = 1.65mm impacting a glass slide with velocity: 1.4m s−1 ( ), 1.9m s−1 ( ), 2.2m s−1 ( ), 2.5m s−1 ( ), and 3.4m s−1 ( ). The transition occurs at r∗ ≈ 1. Lines are guides to the eye. The images show the difference in the shape of a V = 1.8m s−1 drop at times between 0.1ms and 1.5ms, as seen from the side.

![Figure 3.2: Interference images of 9.4mPa s silicone oil drops of radiusR = 1.65mm impacting a glass slide with velocity of 2.2m s−1 as seen from below. The images were taken at t = 0.08, 0.18, 0.24, and 0.46ms after impact and at three different pressures, which were chosen to illustrate the transition in Fig. 3.1: P = 55kPa below the transition pressure, 58kPa in the transition region, and 70kPa above the transition pressure. At the earliest time the image of the spreading liquid is black, indicating that it is in contact with the glass. A trapped air bubble can be seen trapped at the center of each impact [15]. At t = 0.18ms an interference pattern is seen at the edge of the 70kPa drop, indicating that the liquid is now spreading over a thin air gap and that a thin sheet has been created. The air gap is also seen in parts of the liquid edge at 58kPa. At t = 0.24ms the interference patterns grow for both the 58kPa and the 70kPa drops. In the 58kPa images, the regions of the spreading drop that had not already formed a thin sheet remain on the substrate and do not form a thin sheet until a later time. At t = 0.46ms an air gap has finally developed for the 55kPa drop, as well as the remaining regions of the 58kPa case. Close inspection reveals that the liquid locally bridges the air gap near the contact line, as described in [6]. The white scale bar is equivalent to 3.3mm, the diameter of the original drop.](/figures/figure-3-2-interference-images-of-9-4mpa-s-silicone-oil-1060imm8.webp)


