
All figures (10)
![Figure 2a: pH dependence of the chemical shifts of the aquo coordinated ruthenium species and determination of the pKa in the following complexes [1] - Red circles; [2] - Blue squares; [3] - Pink triangles; [4] - black circles; [10] - Green squares; [11] - Orange triangles. 19F chemical shifts of the 5,5’-difluorobipyridyl fluorines or 1H chemical shift of the coordinated benzene ligand were plotted against pD. The lines are a least squares fit to an equation involving a single titratable group. Figure 2b: A series of 19F{1H} decoupled spectra of complex [1] in D2O phosphate buffer at differing pD values (2 mM Ru, 298 K). Figure 2c: The pKa values of a series of ruthenium complexes measured using (where applicable) both 19F{1H} NMR and 1H NMR. (a) – Unable to measure pKa from data collected. (b) – No fluorine atoms present in complex.](/figures/figure-2a-ph-dependence-of-the-chemical-shifts-of-the-aquo-1wfvdup5.png) Figure 2a: pH dependence of the chemical shifts of the aquo coordinated ruthenium species and determination of the pKa in the following complexes [1] - Red circles; [2] - Blue squares; [3] - Pink triangles; [4] - black circles; [10] - Green squares; [11] - Orange triangles. 19F chemical shifts of the 5,5’-difluorobipyridyl fluorines or 1H chemical shift of the coordinated benzene ligand were plotted against pD. The lines are a least squares fit to an equation involving a single titratable group. Figure 2b: A series of 19F{1H} decoupled spectra of complex [1] in D2O phosphate buffer at differing pD values (2 mM Ru, 298 K). Figure 2c: The pKa values of a series of ruthenium complexes measured using (where applicable) both 19F{1H} NMR and 1H NMR. (a) – Unable to measure pKa from data collected. (b) – No fluorine atoms present in complex.
Figure 2a: pH dependence of the chemical shifts of the aquo coordinated ruthenium species and determination of the pKa in the following complexes [1] - Red circles; [2] - Blue squares; [3] - Pink triangles; [4] - black circles; [10] - Green squares; [11] - Orange triangles. 19F chemical shifts of the 5,5’-difluorobipyridyl fluorines or 1H chemical shift of the coordinated benzene ligand were plotted against pD. The lines are a least squares fit to an equation involving a single titratable group. Figure 2b: A series of 19F{1H} decoupled spectra of complex [1] in D2O phosphate buffer at differing pD values (2 mM Ru, 298 K). Figure 2c: The pKa values of a series of ruthenium complexes measured using (where applicable) both 19F{1H} NMR and 1H NMR. (a) – Unable to measure pKa from data collected. (b) – No fluorine atoms present in complex.![Figure 6: A series of 19F{1H} NMR spectra when complex [1] is incubated with the protected amino acids, N-Ac-Cys-OMe, N-Z-Glu-OMe, N-Bz-His-OMe, N-Ac-Met-OMe, and a mixture of all amino acids together, (2 mM Ru, 3 eq. each amino acid, 24 hr, 310 K).](/figures/figure-6-a-series-of-19f-1h-nmr-spectra-when-complex-1-is-19oxlqsx.png) Figure 6: A series of 19F{1H} NMR spectra when complex [1] is incubated with the protected amino acids, N-Ac-Cys-OMe, N-Z-Glu-OMe, N-Bz-His-OMe, N-Ac-Met-OMe, and a mixture of all amino acids together, (2 mM Ru, 3 eq. each amino acid, 24 hr, 310 K).
Figure 6: A series of 19F{1H} NMR spectra when complex [1] is incubated with the protected amino acids, N-Ac-Cys-OMe, N-Z-Glu-OMe, N-Bz-His-OMe, N-Ac-Met-OMe, and a mixture of all amino acids together, (2 mM Ru, 3 eq. each amino acid, 24 hr, 310 K).![Figure 3: A 19F{1H} - 19F{1H} COSY spectra from the incubation of complex [1] with Nacetyl L-glutamine (2 mM Ru, 3 eq. amino acid, starting pD = 7.2, 24 hr, 310 K).](/figures/figure-3-a-19f-1h-19f-1h-cosy-spectra-from-the-incubation-of-1mpv5dl8.png) Figure 3: A 19F{1H} - 19F{1H} COSY spectra from the incubation of complex [1] with Nacetyl L-glutamine (2 mM Ru, 3 eq. amino acid, starting pD = 7.2, 24 hr, 310 K).
Figure 3: A 19F{1H} - 19F{1H} COSY spectra from the incubation of complex [1] with Nacetyl L-glutamine (2 mM Ru, 3 eq. amino acid, starting pD = 7.2, 24 hr, 310 K).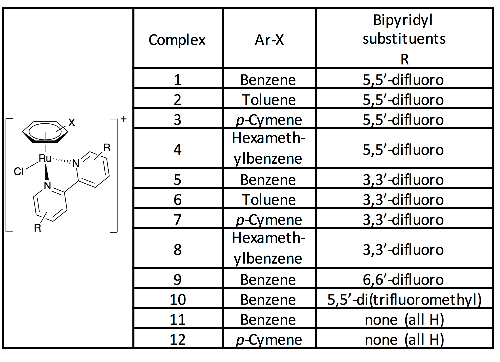 Table 1: Complexes synthesized and studied in this work, isolated and used as the hexafluorophosphate salts.
![Figure 8: A series of 19F{1H} NMR spectra when complex [1] is incubated with defined mixtures of reduced and oxidised glutathione (2 mM Ru, 3 eq. glutathione, 24 hr, 310 K).](/figures/figure-8-a-series-of-19f-1h-nmr-spectra-when-complex-1-is-d1qj48xu.png) Figure 8: A series of 19F{1H} NMR spectra when complex [1] is incubated with defined mixtures of reduced and oxidised glutathione (2 mM Ru, 3 eq. glutathione, 24 hr, 310 K).
Figure 8: A series of 19F{1H} NMR spectra when complex [1] is incubated with defined mixtures of reduced and oxidised glutathione (2 mM Ru, 3 eq. glutathione, 24 hr, 310 K).![Figure 4: A series of 19F{1H} NMR spectra of complexes [1], [3], [5] and [7] incubated with N-acetyl cysteine methyl ester (2 mM Ru, 3 eq. amino acid, 310 K). The chemical shift scale is the same for all spectra, which are aligned to the chloride peak in each case. Absolute d values given in Table S5.](/figures/figure-4-a-series-of-19f-1h-nmr-spectra-of-complexes-1-3-5-2qcy121q.png) Figure 4: A series of 19F{1H} NMR spectra of complexes [1], [3], [5] and [7] incubated with N-acetyl cysteine methyl ester (2 mM Ru, 3 eq. amino acid, 310 K). The chemical shift scale is the same for all spectra, which are aligned to the chloride peak in each case. Absolute d values given in Table S5.
Figure 4: A series of 19F{1H} NMR spectra of complexes [1], [3], [5] and [7] incubated with N-acetyl cysteine methyl ester (2 mM Ru, 3 eq. amino acid, 310 K). The chemical shift scale is the same for all spectra, which are aligned to the chloride peak in each case. Absolute d values given in Table S5.![Figure 5: 19F{1H} NMR spectra of complexes [1], [2], [3] and [4] incubated with N-acetyl cysteine methyl ester (2 mM Ru, 3 eq. amino acid, 24 hr, 310 K). The chemical shift scale is the same for all spectra, which are aligned to the chloride peak in each case. Absolute d values given in Table S5.](/figures/figure-5-19f-1h-nmr-spectra-of-complexes-1-2-3-and-4-renmpbq6.png) Figure 5: 19F{1H} NMR spectra of complexes [1], [2], [3] and [4] incubated with N-acetyl cysteine methyl ester (2 mM Ru, 3 eq. amino acid, 24 hr, 310 K). The chemical shift scale is the same for all spectra, which are aligned to the chloride peak in each case. Absolute d values given in Table S5.
Figure 5: 19F{1H} NMR spectra of complexes [1], [2], [3] and [4] incubated with N-acetyl cysteine methyl ester (2 mM Ru, 3 eq. amino acid, 24 hr, 310 K). The chemical shift scale is the same for all spectra, which are aligned to the chloride peak in each case. Absolute d values given in Table S5.![Figure 1: Figure 1a: The equilibria that exist when [Ru(h6-arene)(5,5’-difluorobipyridine)]+ complexes are incubated in phosphate buffer. Figure 1b: Time course 19F{1H} NMR spectra of complex [4] incubated in 10mM deuterated phosphate buffer (2 mM Ru, pD = 7.2, 310 K). After 24 hr, 1 eq. of AgNO3 was added to abstract the chloride ligand and encourage formation of the aquo complex. Figure 1c: 19F{1H} NMR spectra of complex [2] incubated in D2O and buffered D2O of different phosphate concentration (2 mM Ru, pD = 7.2 (when buffered), 2 hr, 310 K). Figure 1d: Mass spectra recorded of the solution mixture when complex [2] is incubated in D2O and buffered D2O, expected masses quoted in Table S6.](/figures/figure-1-figure-1a-the-equilibria-that-exist-when-ru-h6-1c7km9m2.png) Figure 1: Figure 1a: The equilibria that exist when [Ru(h6-arene)(5,5’-difluorobipyridine)]+ complexes are incubated in phosphate buffer. Figure 1b: Time course 19F{1H} NMR spectra of complex [4] incubated in 10mM deuterated phosphate buffer (2 mM Ru, pD = 7.2, 310 K). After 24 hr, 1 eq. of AgNO3 was added to abstract the chloride ligand and encourage formation of the aquo complex. Figure 1c: 19F{1H} NMR spectra of complex [2] incubated in D2O and buffered D2O of different phosphate concentration (2 mM Ru, pD = 7.2 (when buffered), 2 hr, 310 K). Figure 1d: Mass spectra recorded of the solution mixture when complex [2] is incubated in D2O and buffered D2O, expected masses quoted in Table S6.
Figure 1: Figure 1a: The equilibria that exist when [Ru(h6-arene)(5,5’-difluorobipyridine)]+ complexes are incubated in phosphate buffer. Figure 1b: Time course 19F{1H} NMR spectra of complex [4] incubated in 10mM deuterated phosphate buffer (2 mM Ru, pD = 7.2, 310 K). After 24 hr, 1 eq. of AgNO3 was added to abstract the chloride ligand and encourage formation of the aquo complex. Figure 1c: 19F{1H} NMR spectra of complex [2] incubated in D2O and buffered D2O of different phosphate concentration (2 mM Ru, pD = 7.2 (when buffered), 2 hr, 310 K). Figure 1d: Mass spectra recorded of the solution mixture when complex [2] is incubated in D2O and buffered D2O, expected masses quoted in Table S6.![Figure 7: Structure of complex [13] showing displacement ellipsoids at 50% probability. The counterions, hydrogen atoms and lattice water molecules have been omitted for clarity.](/figures/figure-7-structure-of-complex-13-showing-displacement-2olxac62.png) Figure 7: Structure of complex [13] showing displacement ellipsoids at 50% probability. The counterions, hydrogen atoms and lattice water molecules have been omitted for clarity.
Figure 7: Structure of complex [13] showing displacement ellipsoids at 50% probability. The counterions, hydrogen atoms and lattice water molecules have been omitted for clarity.![Table 2: A comparison of the rate constants for the complexes [1] – [4] for the formation of a ruthenium cysteine adduct (2mM Ru, 3 eq amino acid, 310 K)](/figures/table-2-a-comparison-of-the-rate-constants-for-the-complexes-pvpxzzwc.png) Table 2: A comparison of the rate constants for the complexes [1] – [4] for the formation of a ruthenium cysteine adduct (2mM Ru, 3 eq amino acid, 310 K)
Table 2: A comparison of the rate constants for the complexes [1] – [4] for the formation of a ruthenium cysteine adduct (2mM Ru, 3 eq amino acid, 310 K)
![Figure 2a: pH dependence of the chemical shifts of the aquo coordinated ruthenium species and determination of the pKa in the following complexes [1] - Red circles; [2] - Blue squares; [3] - Pink triangles; [4] - black circles; [10] - Green squares; [11] - Orange triangles. 19F chemical shifts of the 5,5’-difluorobipyridyl fluorines or 1H chemical shift of the coordinated benzene ligand were plotted against pD. The lines are a least squares fit to an equation involving a single titratable group. Figure 2b: A series of 19F{1H} decoupled spectra of complex [1] in D2O phosphate buffer at differing pD values (2 mM Ru, 298 K). Figure 2c: The pKa values of a series of ruthenium complexes measured using (where applicable) both 19F{1H} NMR and 1H NMR. (a) – Unable to measure pKa from data collected. (b) – No fluorine atoms present in complex.](/figures/figure-2a-ph-dependence-of-the-chemical-shifts-of-the-aquo-1wfvdup5.webp)
![Figure 6: A series of 19F{1H} NMR spectra when complex [1] is incubated with the protected amino acids, N-Ac-Cys-OMe, N-Z-Glu-OMe, N-Bz-His-OMe, N-Ac-Met-OMe, and a mixture of all amino acids together, (2 mM Ru, 3 eq. each amino acid, 24 hr, 310 K).](/figures/figure-6-a-series-of-19f-1h-nmr-spectra-when-complex-1-is-19oxlqsx.webp)
![Figure 3: A 19F{1H} - 19F{1H} COSY spectra from the incubation of complex [1] with Nacetyl L-glutamine (2 mM Ru, 3 eq. amino acid, starting pD = 7.2, 24 hr, 310 K).](/figures/figure-3-a-19f-1h-19f-1h-cosy-spectra-from-the-incubation-of-1mpv5dl8.webp)

![Figure 8: A series of 19F{1H} NMR spectra when complex [1] is incubated with defined mixtures of reduced and oxidised glutathione (2 mM Ru, 3 eq. glutathione, 24 hr, 310 K).](/figures/figure-8-a-series-of-19f-1h-nmr-spectra-when-complex-1-is-d1qj48xu.webp)
![Figure 4: A series of 19F{1H} NMR spectra of complexes [1], [3], [5] and [7] incubated with N-acetyl cysteine methyl ester (2 mM Ru, 3 eq. amino acid, 310 K). The chemical shift scale is the same for all spectra, which are aligned to the chloride peak in each case. Absolute d values given in Table S5.](/figures/figure-4-a-series-of-19f-1h-nmr-spectra-of-complexes-1-3-5-2qcy121q.webp)
![Figure 5: 19F{1H} NMR spectra of complexes [1], [2], [3] and [4] incubated with N-acetyl cysteine methyl ester (2 mM Ru, 3 eq. amino acid, 24 hr, 310 K). The chemical shift scale is the same for all spectra, which are aligned to the chloride peak in each case. Absolute d values given in Table S5.](/figures/figure-5-19f-1h-nmr-spectra-of-complexes-1-2-3-and-4-renmpbq6.webp)
![Figure 1: Figure 1a: The equilibria that exist when [Ru(h6-arene)(5,5’-difluorobipyridine)]+ complexes are incubated in phosphate buffer. Figure 1b: Time course 19F{1H} NMR spectra of complex [4] incubated in 10mM deuterated phosphate buffer (2 mM Ru, pD = 7.2, 310 K). After 24 hr, 1 eq. of AgNO3 was added to abstract the chloride ligand and encourage formation of the aquo complex. Figure 1c: 19F{1H} NMR spectra of complex [2] incubated in D2O and buffered D2O of different phosphate concentration (2 mM Ru, pD = 7.2 (when buffered), 2 hr, 310 K). Figure 1d: Mass spectra recorded of the solution mixture when complex [2] is incubated in D2O and buffered D2O, expected masses quoted in Table S6.](/figures/figure-1-figure-1a-the-equilibria-that-exist-when-ru-h6-1c7km9m2.webp)
![Figure 7: Structure of complex [13] showing displacement ellipsoids at 50% probability. The counterions, hydrogen atoms and lattice water molecules have been omitted for clarity.](/figures/figure-7-structure-of-complex-13-showing-displacement-2olxac62.webp)
![Table 2: A comparison of the rate constants for the complexes [1] – [4] for the formation of a ruthenium cysteine adduct (2mM Ru, 3 eq amino acid, 310 K)](/figures/table-2-a-comparison-of-the-rate-constants-for-the-complexes-pvpxzzwc.webp)