


If you are confused about whether you should include pictures, images, charts, and other non-textual elements in your research paper or not, I would suggest you must insert such elements in your research paper. Including non-textual elements like images and charts in the research paper helps extract a higher acceptance of your proposed theories.
An image or chart will make your research paper more attractive, interesting, explanatory, and understandable for the audience. In addition, when you cite an image or chart, it helps you describe your research and its parts with far more precision than simple, long paragraphs.
There are plenty of reasons why you should cite images in your research paper. However, most scholars and academicians avoid it altogether, losing the opportunity to make their research papers more interesting and garner higher readership.
Additionally, it has been observed that there are many misconceptions around the use or citation of images in research papers. For example, it is widely believed and practiced that using pictures or any graphics in the research papers will render it unprofessional or non-academic. However, in reality, no such legit rules or regulations prohibit citing images or any graphic elements in the research papers.
You will find it much easier once you know the appropriate way to cite images or non-textual elements in your research paper. But, it’s important to keep in mind some rules and regulations for using different non-textual elements in your research paper. You can easily upgrade your academic/research writing skills by leveraging various guides in our repository.
In this guide, you will find clear explanations and guidelines that will teach you how to identify appropriate images and other non-textual elements and cite them in your research paper. So, cut the clutter; let’s start.
Importance of citing images in a research paper
Although it’s not mandatory to cite images in a research paper, however, if you choose to include them, it will help showcase your deep understanding of the research topic. It can even represent the clarity you carry for your research topic and help the audience navigate your paper easily.
There are several reasons why you must cite images in your research paper like:
(i) A better explanation for the various phenomenon
While writing your research paper, certain topics will be comparatively more complex than others. In such a scenario where you find out that words are not providing the necessary explanation, you can always switch to illustrating the process using images. For example, you can write paragraphs describing climate change and its associated factors and/or cite a single illustration to describe the complete process with its embedded factors.
(ii) To simplify examples
To create an impeccable research paper, you need to include evidence and examples supporting your argument for the research topic. Rather than always explaining the supporting evidence and examples through words, it will be better to depict them through images. For example, to demonstrate climate change's effects on a region, you can always showcase and cite the “before and after” images.
(iii) Easy Classification
If your research topic requires segregation into various sub-topics and further, you can easily group and classify them in the form of a classification tree or a chart. Providing such massive information in the format of a classification tree will save you a lot of words and present the information in a more straightforward and understandable form to your audience.
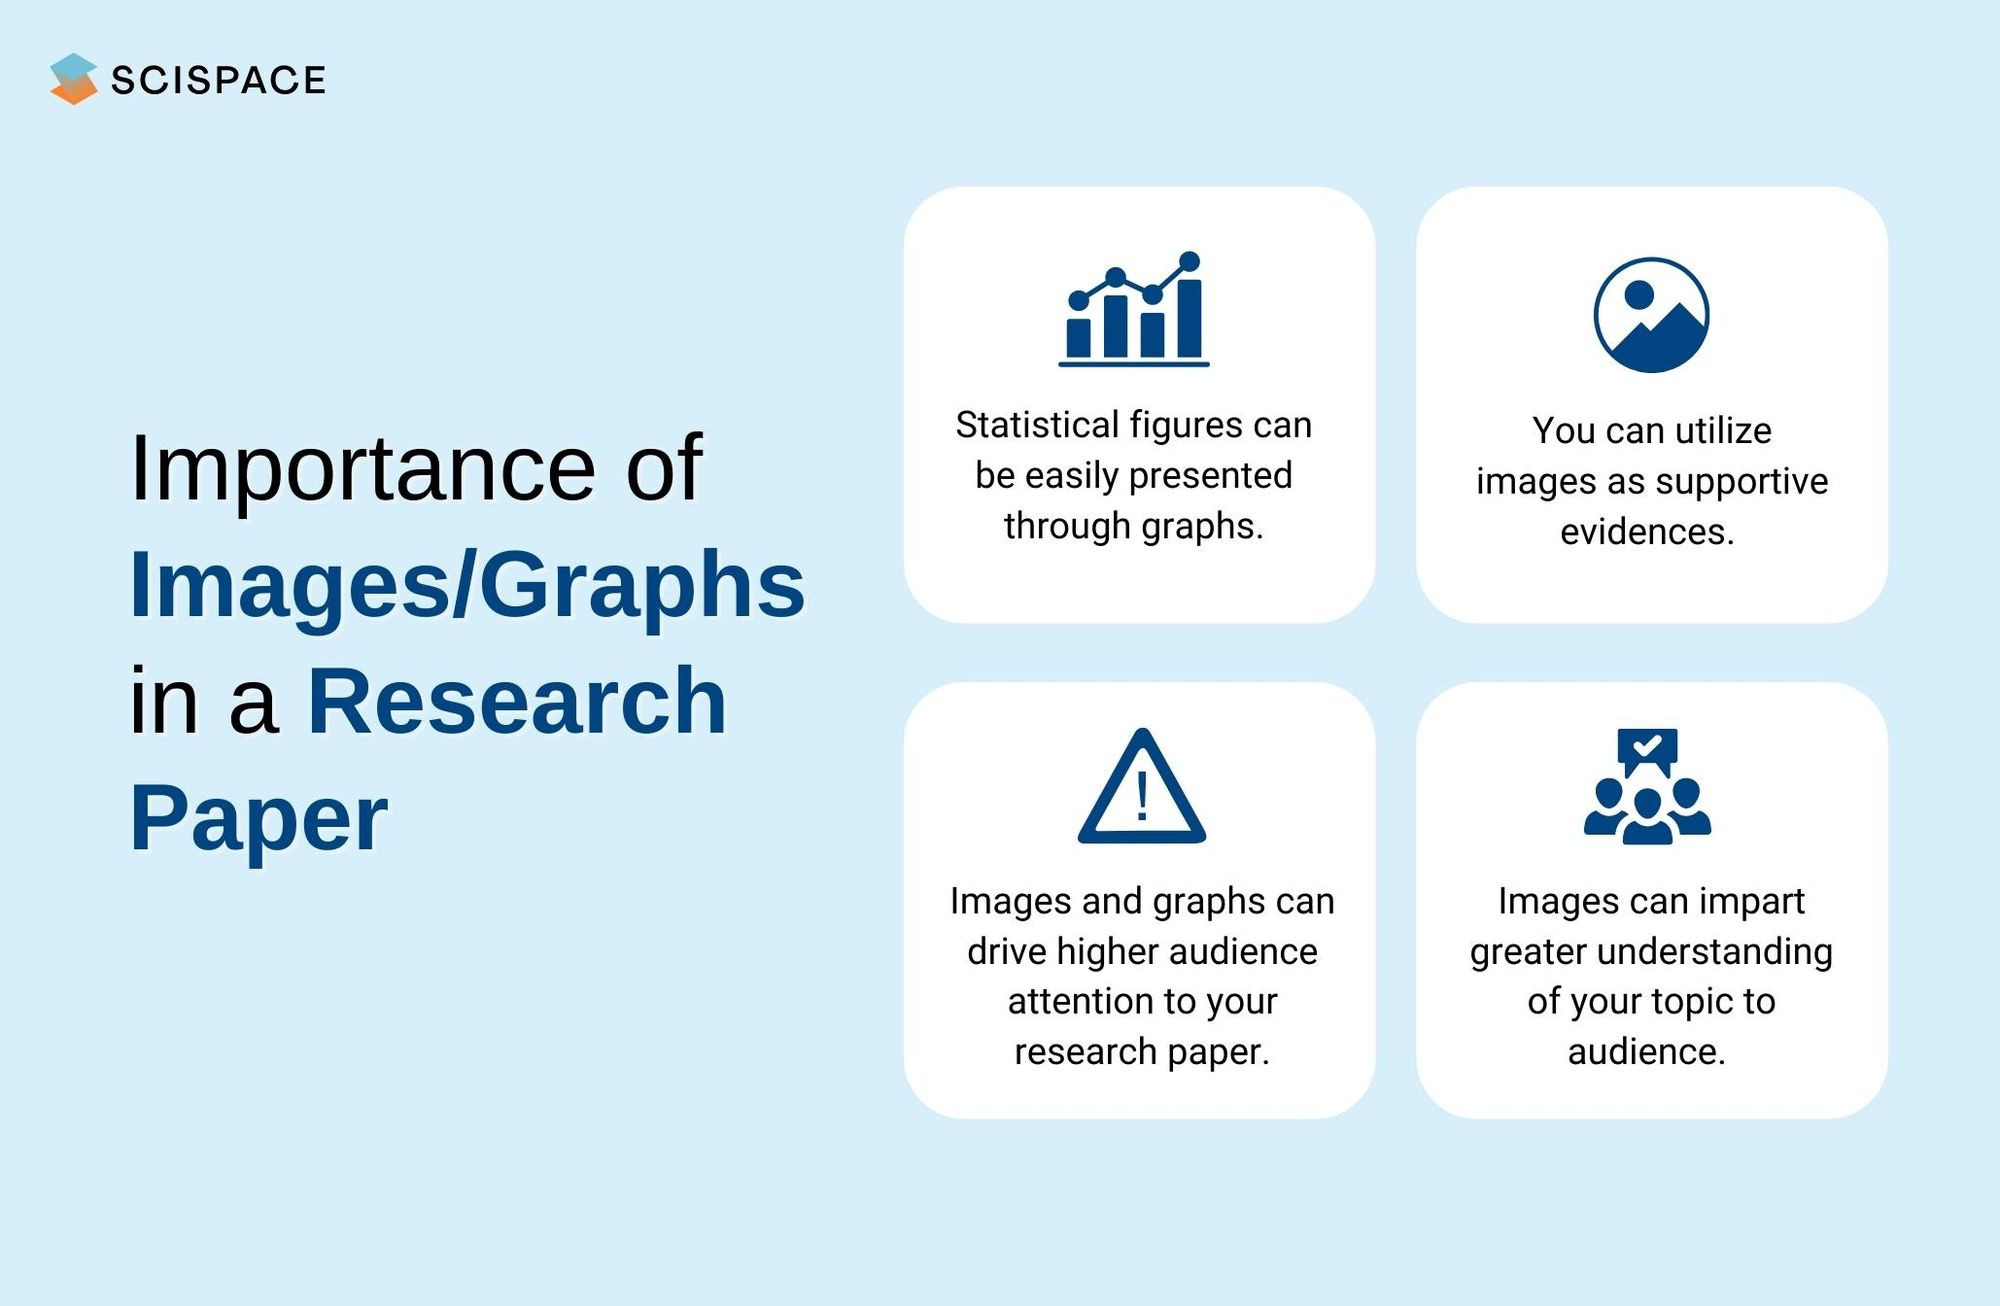
(iv) Acquire greater attention from the audience
Including images in your research paper, theses, and dissertations will help you garner the audience's greater attention. If you add or cite images in the paper, it will provide a better understanding and clarification of the topics covered in your research. Additionally, it will make your research paper visually attractive.
Types of Images that you can use or cite in your research paper
Using and citing images in a research paper as already explained can make your research paper more understanding and structured in appearance. For this, you can use photos, drawings, charts, graphs, infographics, etc. However, there are no mandatory regulations to use or cite images in a research paper, but there are some recommendations as per the journal style.
Pictures
Before including any images in your research paper, you need to ensure that it fits the research topic and syncs with your writing style. As already mentioned, there are no strict regulations around the usage of images. However, you should make sure that it satisfies certain parameters like:
- Try using HD quality images for better picture clarity in both print and electronic formats
- It should not be copyrighted, and if it is, you must obtain the license to use it. In short cite the image properly by providing necessary credits to its owner
- The image should satisfy the context of the research topic
You can cite images in your research paper either at the end, in between the topics, or in a separate section for all the non-textual elements used in the paper. You can choose to insert images in between texts, but you need to provide the in-text citations for every image that has been used.
Additionally, you need to attach the name, description and image number so that your research paper stays structured. Moreover, you must cite or add the copyright details of the image if you borrow images from other platforms to avoid any copyright infringement.
Graphs and Charts
You can earn an advantage by providing better and simple explanations through graphs and charts rather than wordy descriptions. There are several reasons why you must cite or include graphs and charts in your research paper:
- To draw a comparison between two events, phenomena, or any two random parameters
- Illustration of statistics through charts and graphs are most significant in drawing audience attention towards your research topic
- Classification tree or pie charts goes best to show off the degree of influence of a specific event, or phenomenon in your research paper
With the usage of graphs and charts, you can answer several questions of your readers without them even questioning. With charts and graphs, you can provide an immense amount of information in a brief yet attractive manner to your readers, as these elements keep them interested in your research topic.
Providing these non-textual elements in your research paper increases its readability. Moreover, the graphs and charts will drive the reader’s attention compared to text-heavy paragraphs.
You can easily use the graphs or charts of some previously done research in your chosen domain, provided that you cite them appropriately, or else you can create your graphs through different tools like Canva, Excel, or MS PowerPoint. Additionally, you must provide supporting statements for the graphs and charts so that readers can understand the meaning of these illustrations easily.
Similarly, like pictures or images, you can choose one of the three possible methods of placement in your research paper, i.e., either after the text or on a different page right after the corresponding paragraph or inside the paragraph itself.
How to Cite Images and Graphs in a Research Paper?

Once you have decided the type of images you will be using in your paper, understand the rules of various journals for the fair usage of these elements. Using pictures or graphs as per these rules will help your reader navigate and understand your research paper easily. If you borrow or cite previously used pictures or images, you need to follow the correct procedure for that citation.
Usage or citation of pictures or graphs is not prohibited in any academic writing style, and it just differs from each other due to their respective formats.
Cite an Image/Graphs in APA (American Psychological Association) style
Most of the scientific works, society, and media-based research topics are presented in the APA style. It is usually followed by museums, exhibitions, galleries, libraries, etc. If you create your research paper in APA style and cite already used images or graphics, you need to provide complete information about the source.
In APA style, the list of the information that you must provide while citing an element is as follows:
- Owner of the image (artist, designer, photographer, etc.)
- Complete Date of the Image: Follow the simple DD/MM/YYYY to provide the details about the date of the image. If you have chosen a certain historical image, you can choose to provide the year only, as the exact date or month may be unknown
- Country or City where the Image was first published
- A Name or Title of the Image (Optional: Means If it is not available, you can skip it)
- Publisher Name: Organization, association, or the person to whom the image was first submitted
If you want to cite some images from the internet, try providing its source link rather than the name or webpage.
Format/Example of Image Citation:
Johanson, M. (Photographer). (2017, September, Vienna, Austria. Rescued bird. National gallery.
Cite an Image/Graphs in MLA (Modern Language Association) style
MLA style is again one of the most preferred styles worldwide for research paper publication. You can easily use or cite images in this style provided no rights of the image owner get violated. Additionally, the format or the information required for citation or usage is very brief yet precise.
In the MLA style, the following are the details that a used image or graph must carry:
- Name of the creator of the owner
- Title, Name, or the Description of the Image
- Website Or the Source were first published
- Contributors Name (if any)
- Version or Serial Number (if any)
- Publisher’s Details; at least Name must be provided
- Full Date (DD:MM: YYYY) of the first published Image
- Link to the original image
Format/Example of Image Citation:
Auteur, Henry. “Abandoned gardens, Potawatomi, Ontario.” Historical Museum, Reproduction no. QW-YUJ78-1503141, 1989, www.flickr.com/pictures/item/609168336/
Final Words
It is easy to cite images in your research paper, and you should add different forms of non-textual elements in the paper. There are different rules for using or citing images in research papers depending on writing styles to ensure that your paper doesn’t fall for copyright infringement or the owner's rights get violated.
No matter which writing style you choose to write your paper, make sure that you provide all the details in the appropriate format. Once you have all the details and understanding of the format of usage or citation, feel free to use as many images that make your research paper intriguing and interesting enough.
If you still have doubts about how to use or cite images, join our SciSpace (Formerly Typeset) Community and post your questions there. Our experts will address your queries at the earliest. Explore the community to know what's buzzing and be a part of hot discussion topics in the academic domain.
Learn more about SciSpace's dedicated research solutions by heading to our product page. Our suite of products can simplify your research workflows so that you can focus more on what you do best: advance science.
With a best-in-class solution, you can handle everything from literature search and discovery to profile management, research writing, and formatting.


