All figures (6)
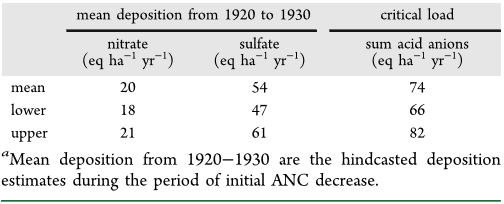
Table 1. Mean Critical Load Results Presented with 90% Upper and Lower Confidence Intervalsa 
Figure 5. Residuals for regression between April 1st SWE and fall ANC at Emerald Lake graphed against year. 
Figure 4. Time series graphs for a) Sierra Nevada mean annual air temperature, b) Sierra Nevada mean annual precipitation, c) April 1st SWE at Donner Summit (DNS) and Virginia Lakes (VGL), d) national NOx and SO2 emissions, and e) diatom reconstructed ANC at Moat Lake. The slopes are reported as the 95% CI range. 
Figure 3. PCA plot for Moat Lake sediment, emissions, and climate variables. 
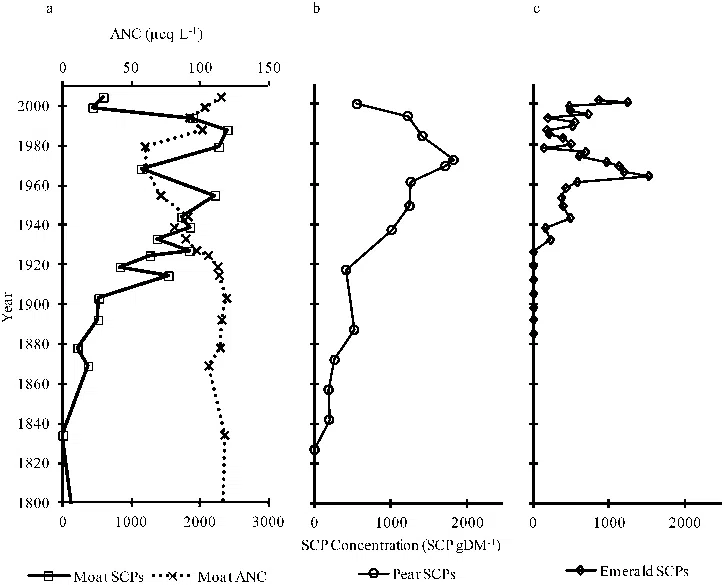
Figure 1. a) Moat Lake SCP concentrations and reconstructed ANC, b) Pear Lake SCP concentrations, and c) Emerald Lake SCP concentrations. 
Figure 2. BSi and δ13C profiles for Moat Lake.