
All figures (33)

Figure 5.10: Longitudinal and lateral stick time histories for the offset high left approach using both methods. 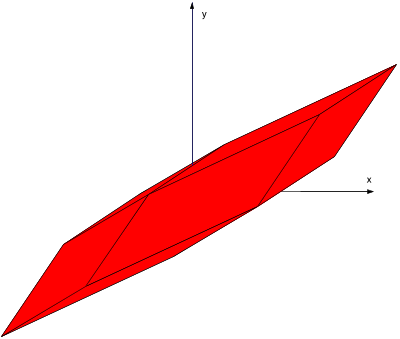
Figure 2.3: Three-dimensional AMS rotated such that the view point is looking down the z-axis of the problem. 
Figure 4.4: AMS described by the original Control Effectivness Matrix B with Scaled Final B used in the Research. 
Figure 4.3: AMS described by the scaled Control Effectivness Matrix B plotted with the desired moments of the offset approach task. 
Figure 5.7: Desired moment time histories plotted with attained moments for the offset left approach using the method of scaling the moment direction. 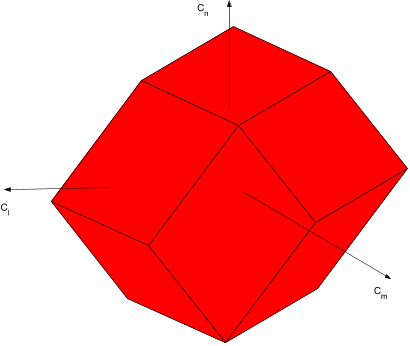
Figure 1.2: General Attainable Moment Subset for a 4 Control Problem 
Figure 5.2: Comparison of the saturation of control surfaces between scaling the moment direction and prioritizing the pitch axis for an offset left maneuver. 
Figure 5.11: Angle of attack time histories for the offset high left approach using both methods. 
Figure 5.15: Desired moment time histories plotted with attained moments for the offset high left approach using the method of pitch prioritization. 
Figure 5.14: Desired moment time histories plotted with attained moments for the offset high left approach using the method of preserving the moment direction. 
Table 3.1: Control Surfaces on the testbed airframe. 
Figure 4.5: AMS as viewed down the +x-axis with the desired moments of the offset approach maneuver superimposed. 
Figure 2.1: Two-dimensional AMS. Star represents the starting vertex of the AMS. x and y axes correspond to arbitrary moment directions. 
Figure 5.8: Desired moment time histories plotted with attained moments for the offset left approach using the method of pitch prioritization. 
Figure 5.13: Desired moment time histories for the offset high left approach using both methods. 
Figure 3.1: Block Diagram of the Testbed Airframe Simulation Structure 
Figure 1.1: Control Loop Block Diagram 
Figure 4.6: AMS as viewed down the +x-axis. The method of control vector scaling is implemented. 
Figure 4.7: AMS as viewed down the +x-axis. The method of pitch prioritization is implemented. 
Figure 4.1: AMS described by the original Control Effectivness Matrix B. 
Figure 5.4: Angle of attack time histories for the offset left approach using both methods. 
Figure 5.5: Aircraft pitch and roll rate time histories for the offset left approach using both methods. 
Figure 1.4: Method of prioritizing the pitch axis 
Figure 1.3: Method of scaling control solution vector to preserve moment direction 
Figure 3.2: Control Loop Block Diagram 
Figure 5.1: Path of the airframe during a high left offset carrier landing approach. 
Figure 4.8: AMS as viewed down the +x-axis. The method of pitch prioritization is implemented during the case where control power is insufficient for attaining the desired amount of pitching moment. 
Figure 5.9: Comparison of the saturation of control surfaces between scaling the moment direction and prioritizing the pitch axis for an offset high left maneuver. 
Figure 2.2: 3 dimensional AMS orientated such that the x-axis (desired objective) is viewed coming out of a specific facet. 
Figure 5.12: Aircraft pitch and roll rate time histories for the offset high left approach using both methods. 
Figure 4.2: AMS described by the original Control Effectivness Matrix B plotted with the desired moments of the offset approach task. 
Figure 5.6: Desired moment time histories for the offset left approach using both methods. 
Figure 5.3: Longitudinal and lateral stick time histories for the offset left approach using both methods.


05 Aug 2002-