
All figures (18)
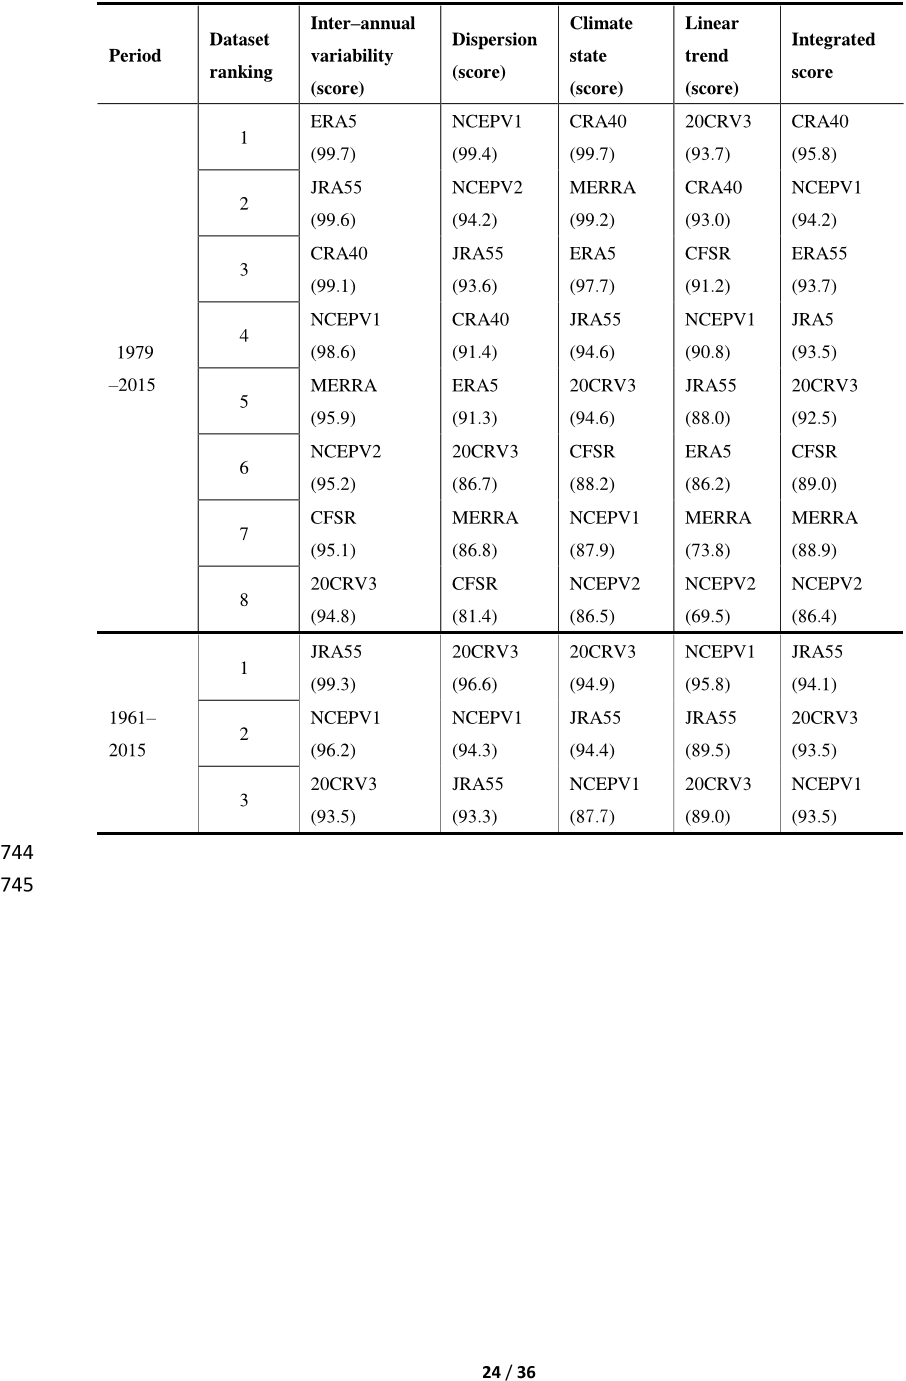 Table 5. Ranking and score of each of the reanalysis datasets in mainland China for the periods 742 1961–2015 and 1979–2015 743
 Figure 1. Distribution of the elevation distribution and 763 observation stations across mainland 748 China. (The insert shows the number of stations at various elevations, the asl stands for elevation 749 (units: m), the red bar stands for the number of the elevation distribution) 750
 Table 1. Atmospheric reanalysis datasets applied in this study 722
 Figure 5. Annual mean SAT and annual mean SAT linear trends for the periods 1961–2015 and 768 1979–2015. (The red bar stand for climate state (units: °C), the orange bar stands for linear trends 769 (units: °C/10 years)) 770
 Figure 4. Wavelet analysis based on REAs and OBS from 1961–2015: (a) NCEPV1; (b) JRA55; 763 (c) 20CRV3; (d) CRA40; (e) NCEPV2; (f) ERA5; (g) CFSR ; (h) MERRA ; (i) OBS. 764
 Table 2. Relative bias between the REAs and OBS for climate state and linear trends for the 726 periods 1961–2015 and 1979–2015 727
 Figure 9. The biases of climate state and linear trends of annual mean temperature between REAs 791 and OBS for the period 1961–2015. (a) NCEPV1; (b) JRA55; (c) 20CRV3. 792 (The asl stands for elevation (units: m); y-axis stand for the bias of climate state (units: °C); x-axis 793 stand for the bias of linear trends (units: °C/10 years); red bar stand for the number of stations with 794 different bias of linear trends; blue bar stand for the number of stations with different bias of climate 795 state; purple dots represent the altitude of stations above 3000m;blue dots represent the altitude of 796 stations between 1500-3000m; orange dots represent the altitude of stations between 500-1500m; 797 green dots represent the altitude of stations less than 500m) 798
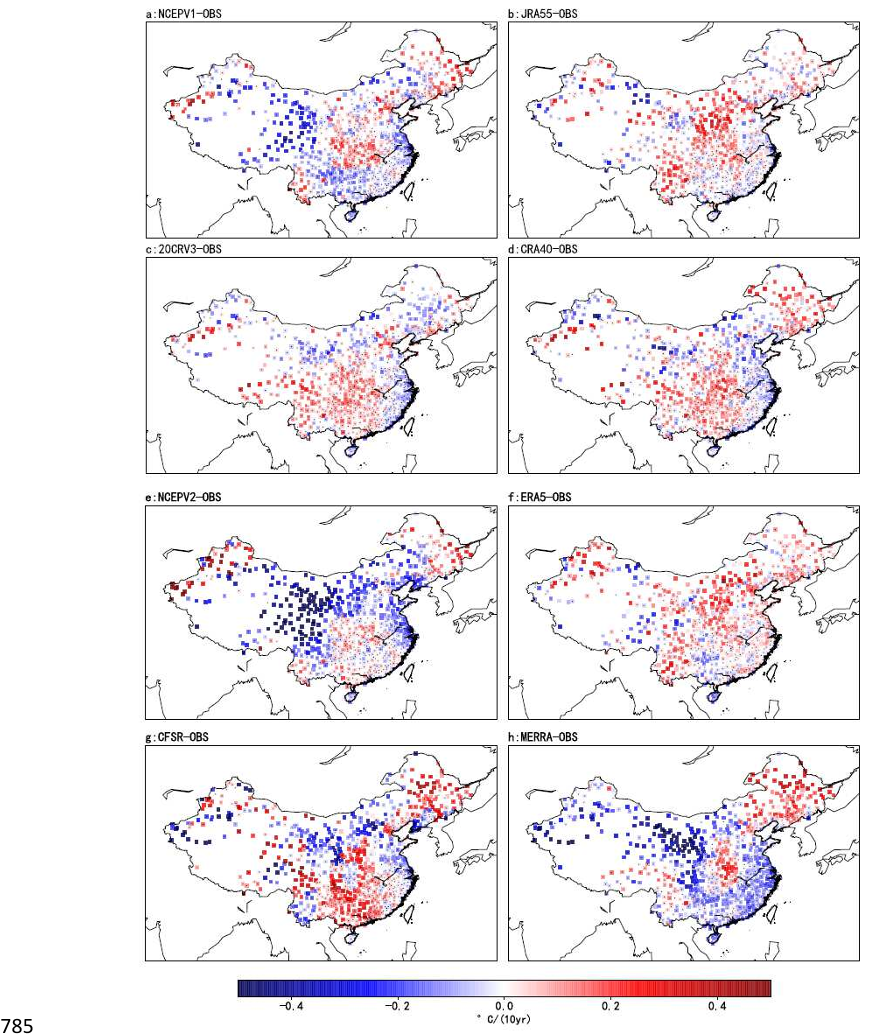 Figure 8. Spatial distribution of linear trend bias between REA and OBS for the period 1979–2015 786 across China:(a) NCEPV1; (b) JRA55; (c) 20CRV3; (d) CRA40; (e) NCEPV2; (f) ERA5; (g) CFSR; 787 (h) MERRA.(The black dots represent significant deviation, the value of color bar means the linear 788 trend bias (units: °C/10year)) 789
 Figure 10. The biases of climate state and linear trends of annual mean temperature between the 801 REAs and OBS for the period 1979–2015. (a) NCEPV1; (b) JRA55; (c) 20CRV3; (d) CRA40; (e) 802 NCEPV2; (f) ERA5; (g) CFSR; (h) MERRA. 803 (The asl stands for elevation (units: m); y-axis stand for the bias of climate state (units: °C); x-axis 804 stand for the bias of linear trends (units: °C/10 years); red bar stand for the number of stations with 805 different bias of linear trends; blue bar stand for the number of stations with different bias of climate 806 state; purple dots represent the altitude of stations above 3000m;blue dots represent the altitude of 807 stations between 1500-3000m; orange dots represent the altitude of stations between 500-1500m; 808 green dots represent the altitude of stations less than 500m) 809
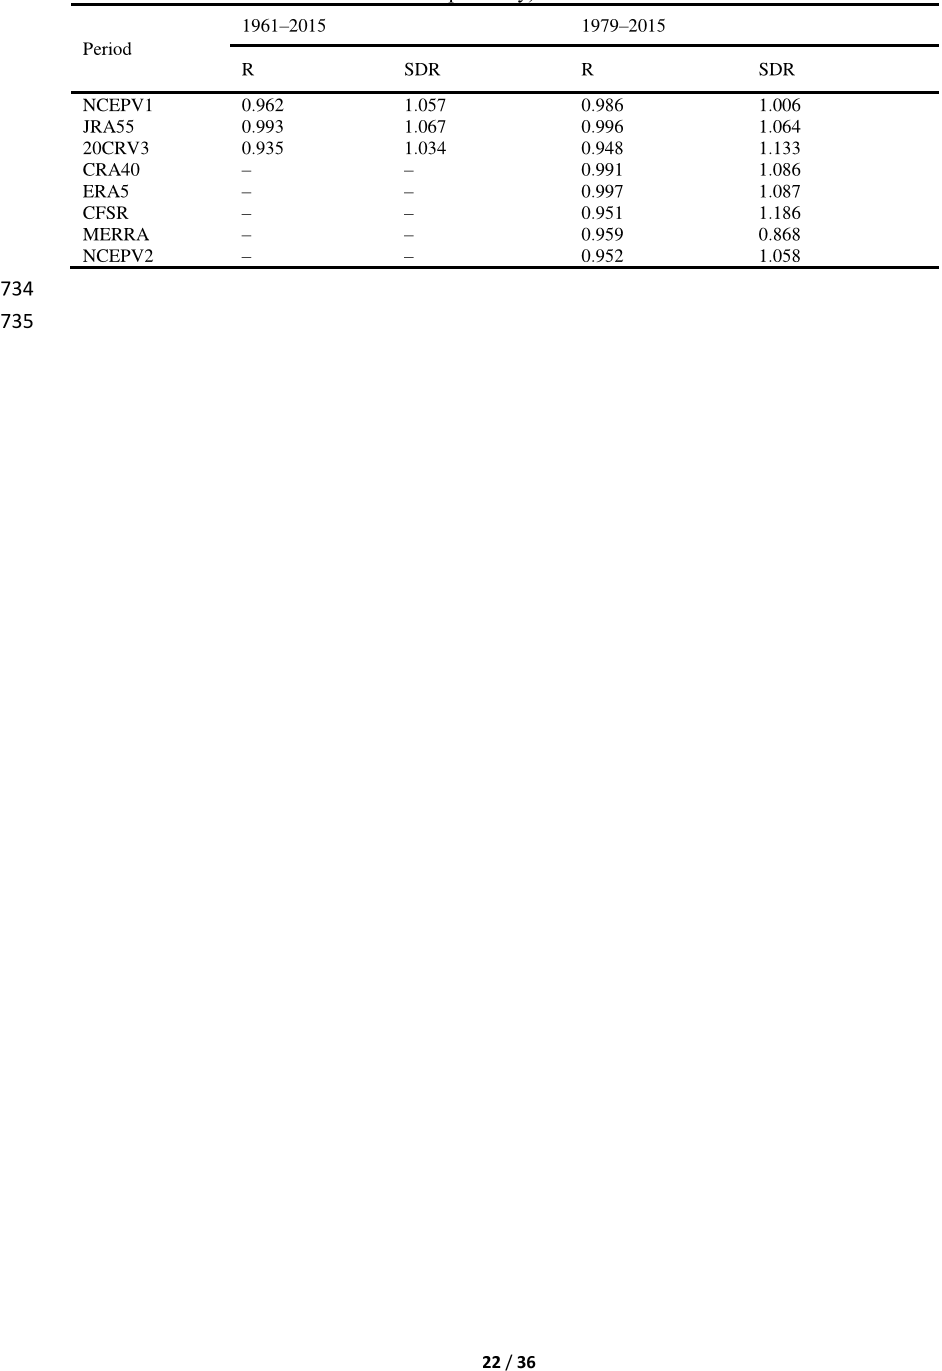 Table 3. Standard deviation ratio (SDR) and correlation coefficient (R) of annual mean SAT across 731 China derived from REAs and OBS for the periods 1961–2015 and 1979–2015 (thresholds for the 732 95% confidence level are 0.26 and 0.32 respectively) 733
 Figure 3. The bias of monthly mean SAT between REAs and OBS from 1961–2015 across 758 mainland China: (a) NCEPV1; (b) JRA55; (c) 20CRV3; (d) CRA40; (e) NCEPV2; (f) ERA5; (g) 759 CFSR; (h) MERRA. (The value of color bar means the monthly mean SAT bias (units: °C)) 760
 Figure 11. Taylor diagrams of annual mean SAT for 763 stations across mainland China derived by 812 the REAs and OBS for the period 1961–2015: (a) NCEPV1; (b) JRA55; (c) 20CRV3. 813 (The asl stands for elevation (units: m), the purple dots represent the altitude of stations above 814 3000m. The blue dots represent the altitude of stations between 1500-3000m. The orange dots 815 represent the altitude of stations between 500-1500m. The green dots represent the altitude of 816 stations less than 500m, threshold for the 95% confidence level is 0.26) 817
 Figure 7. Spatial distribution of linear trend of OBS and linear trend bias between REA and OBS 780 for the period 1961–2015 across China:(a)NCEPV1; (b) JRA55; (c) 20CRV3 (d) OBS. 781 (The black dots represent significant deviation, the value of color bar means the linear trend bias 782 and linear trend (units: °C/10year)) 783
 Figure 2. Time series of annual mean SAT across mainland China from 1961–2015 derived from 754 OBS and REAs: (a)SAT; (b) SAT anomalies; (c) SAT with linear trends removed. (units: °C) 755
 Table 4. R and SDR values between the REAs and OBS at different elevations for the periods 737 1961–2015 and 1979–2015 738
 Figure 12. Taylor diagrams of annual mean SAT for 763 stations across mainland China derived 820 by the REAs and OBS for the period 1979–2015:(a) NCEPV1; (b) JRA55; (c) 20CRV3; (d) CRA40; 821 (e) NCEPV2; (f) ERA5; (g) CFSR; (h) MERRA. 822 (The asl stands for elevation (units: m), the purple dots represent the altitude of stations above 823 3000m. The blue dots represent the altitude of stations between 1500-3000m. The orange dots 824 represent the altitude of stations between 500-1500m. The green dots represent the altitude of 825 stations less than 500m, threshold for the 95% confidence level is 0.32) 826
 Figure 6. Spatial distribution of annual mean SAT bias of REAs from observations for the period 773 1979–2015 across mainland China:(a)NCEPV1; (b) JRA55; (c) 20CRV3; (d) CRA40; (e) NCEPV2; 774 (f) ERA5; (g) CFSR; (h) MERRA 775 (The black dots represent significant deviation, the value of color bar means the annual mean SAT 776 bias (units: °C)) 777
 Figure 1. Distribution of the elevation distribution and 763 observation stations across mainland 748 China. (The insert shows the number of stations at various elevations, the asl stands for elevation 749 (units: m), the red bar stands for the number of the elevation distribution) 750


