All figures (12)

Table 2: Logistic Regression Model for ABCD Sample Propensity Scores. 
Table 3: U.S. Population Totals for Final Raking Step in ABCD Population Weight Calculation. 
Figure 1: Distribution of ABCD Baseline Population Weights. 
Table 7 aim to capture/model the complex variance structure of clustering and non-independence of the baseline observations for the ABCD child cohort. The design-based estimation approaches employ the population weights described in Section 6 above and use a weighted least squares (WLS) methodology to estimate the population regression parameters. Under the design-based approaches, a Taylor Series Approximation (or sandwich estimator) is used to compute robust estimates of standard errors. However, unlike the LMM approach, the components of variance associated with each level of clustering are estimated as a single weighted aggregate for the residual variance and not as individual components of variance attributable to each level of the clustering. The three-level LMM used here does not include population weighting in estimating the regression parameters. The three-level LMM does produce estimates of the variance 
Figure 3: Distributions of ABCD Analysis Weights by Family Income Category 
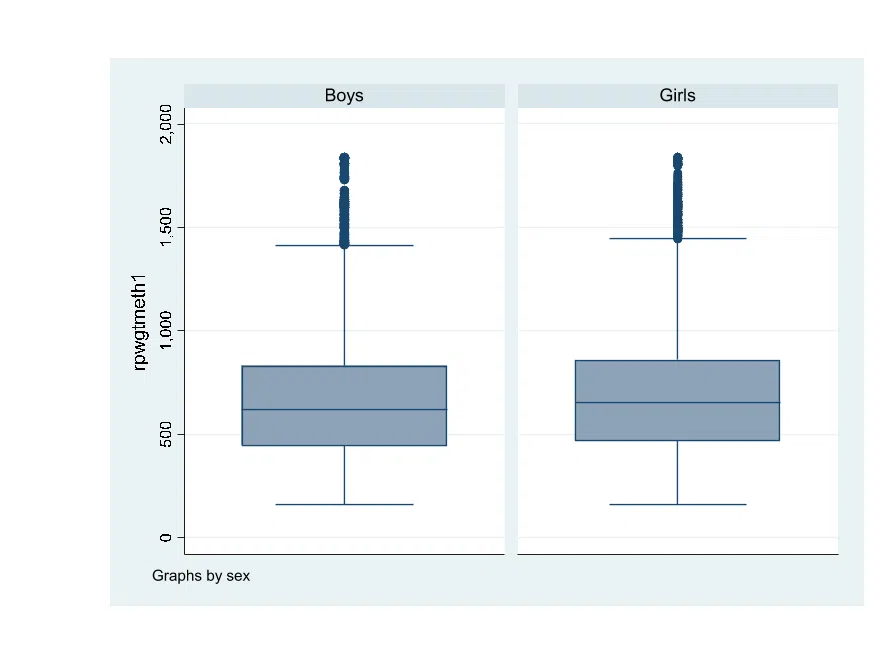
Figure 2: Distribution of ABCD Baseline Population Weights by Sex of Child 
Table 7 aim to capture/model the complex variance structure of clustering and non-independence of the baseline observations for the ABCD child cohort. The design-based estimation approaches employ the population weights described in Section 6 above and use a weighted least squares (WLS) methodology to estimate the population regression parameters. Under the design-based approaches, a Taylor Series Approximation (or sandwich estimator) is used to compute robust estimates of standard errors. However, unlike the LMM approach, the components of variance associated with each level of clustering are estimated as a single weighted aggregate for the residual variance and not as individual components of variance attributable to each level of the clustering. The three-level LMM used here does not include population weighting in estimating the regression parameters. The three-level LMM does produce estimates of the variance 
Table 9: Poisson Regression for Count of Lifetime ER Visits. Source: ABCD Baseline. 
Table 2: Logistic Regression Model for ABCD Sample Propensity Scores. 
Table 4. ABCD Baseline Weighted and Propensity Weighted Estimates of Population Demographics 
Table 1: ABCD Baseline Cohort Demographic and Socio-Economic Characteristics (Unweighted). 
Table 8: Poisson Regression of Lifetime ER Visit Counts. Source: ABCD Baseline.