
All figures (11)

Fig. 3 Correlated paths steps with ε = 0.5, ∆ t` = 0.2 and ∆ t`−1 = 1. Stars mark collisions. 
Table 1 Results of the simulation described in Section 4.2 for an error bound E = 0.1. 
Table 2 Results of the simulation described in Section 4.2 for an error bound E = 0.01. 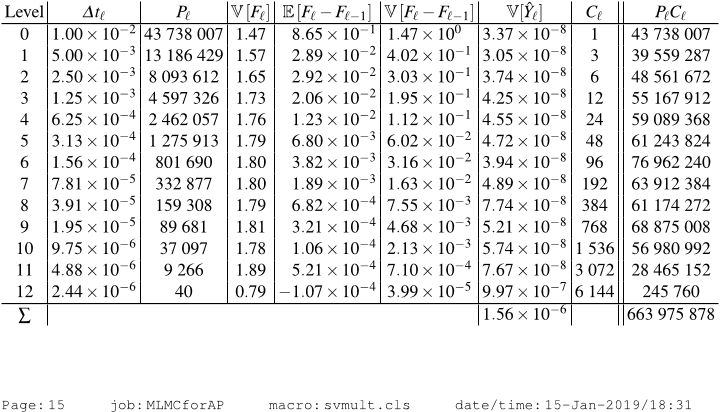
Table 3 Results of the simulation described in Section 4.2 for an error bound E = 0.001. 
Fig. 6 Mean and variance of the squared particle position for ε = 0.1. 
Fig. 7 Mean and variance of the squared particle position for ε = 0.01. 
Fig. 1 Correlated diffusion steps with ε = 0.5, ∆ t` = 0.2 and ∆ t`−1 = 1. 
Fig. 4 Mean and variance of the squared particle position for ε = 10. 
Fig. 5 Mean and variance of the squared particle position for ε = 1. 
Fig. 2 Correlated transport steps with ε = 0.5, ∆ t` = 0.2 and ∆ t`−1 = 1. Stars mark collisions. 
Table 4 Cost comparison between classical and multilevel Monte Carlo


