
All figures (12)
 Fig. 8. (a) Bias and (b) Variance of the estimation error for a GPR with a central frequency of 2GHz NA, and three different heights (30, 40, and 50 cm) from the metal plate.
 Fig. 7. (a) Bias and (b) Variance of the estimation error for a GPR with a central frequency of 2GHz EU, and three different heights (30, 40, and 50 cm) from the metal plate.
 Fig. 1. Typical reflection pattern of a GPR measurement in multi-layered structures with an aircoupled radar system: (a) trend of reflections in a cross-section of a multi-layered structure; (b) sketch of the relevant GPR signal trace.
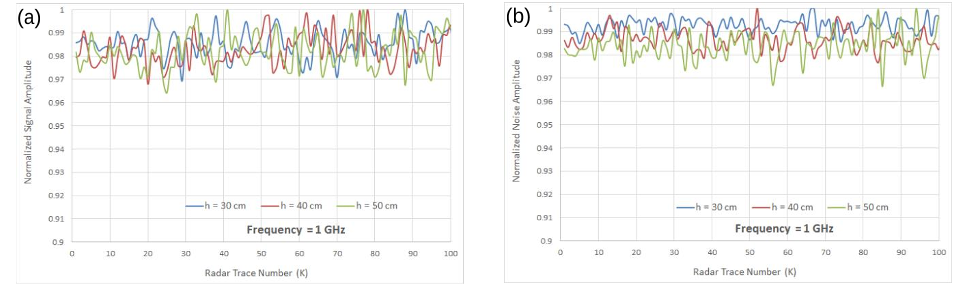 Fig. 3. Normalized (to 1) amplitude variations for 100 consecutive radar traces of: (a) the signal peak (As), and (b) the noise peak (An) after PEC reflection, with the 1GHz GPR system.
 Fig. 10. Accuracy vs. optimal threshold for a GPR with a central frequency of 2GHz EU at three different heights (30, 40, and 50 cm) from the metal plate
 Fig. 9. Accuracy vs. optimal threshold for a GPR with a central frequency of 1GHz at three different heights (30, 40, and 50 cm) from the metal plate
 Fig. 4. Normalized (to 1) amplitude variations for 100 consecutive radar traces of: (a) the signal peak (As), and (b) the noise peak (An) after PEC reflection, with the 2GHz EU GPR system.
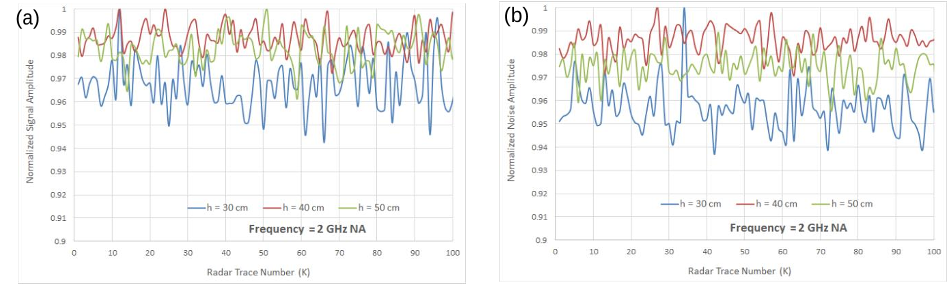 Fig. 5. Normalized (to 1) amplitude variations for 100 consecutive radar traces of: (a) the signal peak (As), and (b) the noise peak (An) after PEC reflection, with the 2GHz NA GPR system.
 Fig. 2. Laboratory-scale set-up for the investigation at 30 cm of height between the bottom of the radar box and the PEC surface.
 Fig. 11. Accuracy vs. optimal threshold for a GPR with a central frequency of 2GHz NA at three different heights (30, 40, and 50 cm) from the metal plate
 Fig. 12. Threshold values (for a signal accuracy of 90%) for GPR systems with different antennas (1GHz, 2GHz NA, and 2GHz EU) at three heights (30, 40, and 50 cm) from the metal plate.
 Fig. 6. (a) Bias and (b) Variance of the estimation error for a GPR with a central frequency of 1GHz, and three different heights (30, 40, and 50 cm) from the metal plate.


