
All figures (12)
Fig. 4 Four schlieren images from four separate experiments overlaid with the location of the gravity current at the instant of detonation initiation. Ethylene-oxygen (Φ=2.5) is the combustible mixture with pure nitrogen as the test gas. The delay times are 0 s (a), 1 s (b), 2 s (c), and 3 s (d). The vertical height yo is used to estimate the composition profile. 
Fig. 5 Estimated mole fraction plotted as a function of vertical distance y in the test section. Two profiles are shown based on Equation (1) for the oxygen dilution case (O2) and the nitrogen dilution case (N2). 
Fig. 12 A sketch of a fluid element expanding during chemical reaction at constant pressure and enthalpy. 
Fig. 11 Induction time vs. oxygen mass fraction computed using a homogeneous mixing ignition time calculation (HMIT) on the left axis. Temperature and specific volume ratio vs. oxygen mass fraction on the right axis 
Fig. 1 The interaction of a detonation with a diffuse interface is illustrated with supporting observations from experimental images. A detonation wave (a) interacts with the diffuse interface and forms a curved wave (b). Upon exiting the combustible mixture, the detonation decouples completely resulting in a transmitted shock and TMZ (c) and (d). When the shock reaches the endwall it reflects (e) and interacts for a second time with the interface. 
Fig. 13 Impulse increment (%) for oxygen compared to nitrogen versus delay time. The impulse model prediction is plotted for a range of proportionality factors. 
Fig. 8 Detonation velocity plotted as a function of vertical distance (y) in the test section. The profiles are shown for the oxygen dilution case (O2) and the nitrogen dilution case (N2). 
Fig. 7 ZND induction time plotted as a function of vertical distance y in the test section. The profiles are shown for the oxygen dilution case (O2) and the nitrogen dilution case (N2). 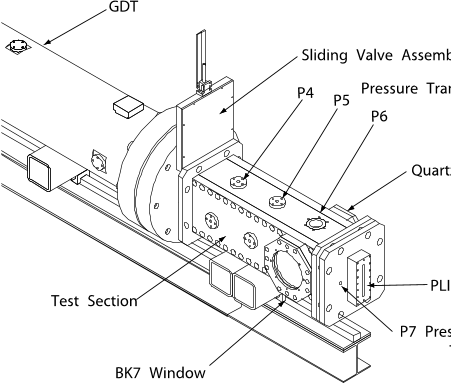
Fig. 2 A schematic of the test section with the sliding valve assembly and the end flange of the GDT. 
Fig. 10 An overlay of pressure and impulse vs. time at pressure transducer P5. The mixture is composed of 2.5C2H4 + 3O2 with O2 as the test gas. 
Fig. 9 Estimated wave shape y(x) for the oxygen dilution and the nitrogen dilution cases compared with the experimental results. 
Fig. 3 Time sequence illustrating the development of a gravity current using dye visualization. The gravity current head in the dense fluid (at bottom of image) is propagating from right to left. The dark colored fluid is the salt water solution and the clear fluid is de-ionized water. The plate is completely withdrawn at 0.16 s.


