
All figures (10)
 FIG. 5. Color online The finite-temperature correction to the optical spectral weight thick curves , for various values of t , as indicated. Also plotted is the analogous quantity for the kinetic energy which, by Eq. 8 , is just −8tg F . Note that the latter is always negative, while the spectral weight becomes positive for a finite electron concentration for electron hole densities below above the van Hove singularity. The magnitude of the anomalous region increases with increasing t .
 FIG. 6. Color online Spectral weight for four representative densities for the t-t model see Fig. 5 . The progression from top to bottom is from high electron concentration to low electron concentration. Note the qualitative change from negative slope lowersuperconducting vs normal-state difference to positive slope higher-superconducting vs normal-state difference as the electron concentration changes such that the chemical potential sweeps through the van Hove singularity.
 FIG. 1. Color online Spectral weight vs T2 for a half-filling and b n=0.5. The normal state is given by the solid red curve, and the superconducting state with d-wave s-wave symmetry by the short-dashed blue dashed green curve. In both cases the normalstate result is almost linear in T2 and the superconducting state shows a decrease in the spectral weight increase in the kinetic energy as expected. We used t=0.4 eV and BCS values for order parameters, etc., with Tc=69 K.
 FIG. 8. Color online Spectral weight difference solid red curve as a function of electron concentration for the band structure determined by ARPES Ref. 24 . For simplicity we put Tc=70 K for all electron densities. The normal-state slope shows very similar behavior. Also plotted is the negative of the change in the kinetic energy dashed green curve and the density of states at the Fermi level dot-dashed cyan curve , for reference. Note that “anomalies” in the spectral weight occur at the two van Hove singularities, while the change in kinetic energy is simply gently modulated by the density of states. Also shown with solid blue symbols is the hole doping regime of relevance to the BSCCO experiments in Ref. 14 and considered in the previous figure. For clarity only d-wave results are shown. The three open squares show the doping concentrations considered in the next figure, of possible relevance for overdoped samples with chemical potential that crosses the van Hove singularity Ref. 30 .
 FIG. 7. Color online Spectral weight for the four hole doping concentrations along with their measured Tc’s considered in the experiments Ref. 14 . These calculations use the ARPESdetermined band structure parameters from Ref. 24, including the bilayer splitting. Slopes are always negative, and the change at Tc is also always negative. Note that in this case the s-wave order parameter gives roughly the same value as the d-wave parameter.
 FIG. 2. Color online The difference Wd−WN in the spectral weight between the superconducting state with d-wave symmetry and the normal state at zero temperature vs doping dotted blue curve . The dashed green curve shows the same quantity for s-wave symmetry, and the pink points indicate the slope with respect to T2 of the spectral weight near Tc. All three quantities are always negative and show an enhancement near half-filling due to the van Hove singularity. In fact, the pink points are almost a perfect inverted image of the density of states see the minus sign in Eq. 8 , except for the small density regime near half-filling, where the van Hove singularity makes the Sommerfeld expansion invalid.
 FIG. 10. Color online Spectral weight at zero temperature in the normal state vs electron concentration for four different band structures: that applicable to BSCCO solid red curve , the t-t model with t=0.40 eV and t =0.09 eV long-dashed green curve and with t =−0.09 eV short-dashed blue curve , and the nearestneighbor hopping only model, with t=0.40 eV. The three models that are physically relevant to the hole-doped cuprates LSCO and BSCCO have non-negative next nearest-neighbor hopping t and show a spectral weight that decreases with increasing hole doping over the relevant hole doping regime see thick solid red line along the bottom axis . See text for further discussion.
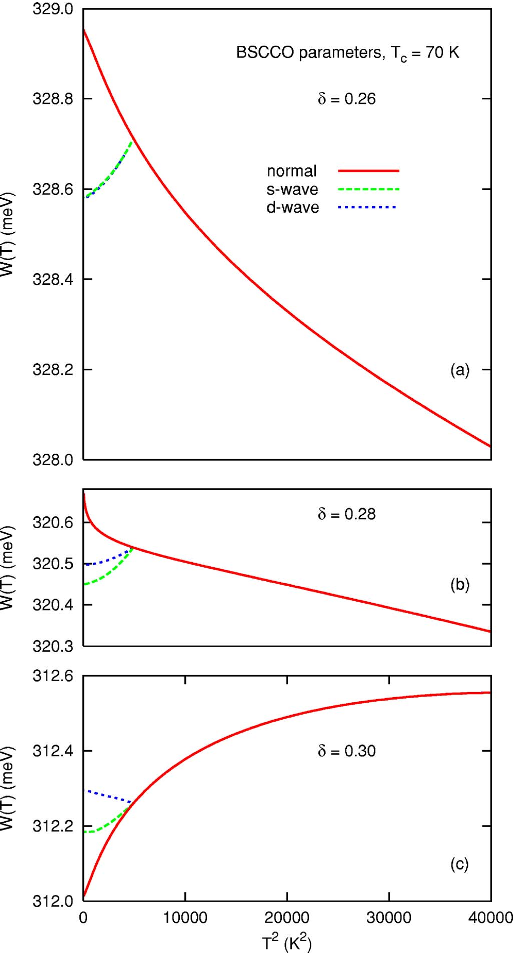 FIG. 9. Color online Spectral weight for three hole doping concentrations that move the chemical potential across the first van Hove singularity see Fig. 8 . Note the dramatic change that occurs as one dopes across the van Hove singularity see text .
 FIG. 4. Color online a The difference Wd−WN in the spectral weight between the superconducting state with d-wave symmetry and the normal state at zero temperature vs doping solid red curve , for the t-t band structure, with t=0.4 eV and t =0.09 eV. The dashed green curve shows the same quantity for s-wave symmetry. Both exhibit positive values to the left of the van Hove singularity the density of states at the Fermi level is indicated, as a function of doping, by the dot-dashed cyan curve . The negative of the kinetic energy for d-wave blue short-dashed curve and for s-wave dotted pink curve symmetry behaves as expected, always negative, and peaks in absolute value at the van Hove singularity. b The normal-state slope taken at Tc=69 K of the spectral weight vs doping solid red curve . The dashed green curve shows the same quantity for the negative of the kinetic energy. These behave in very similar fashion to the differences taken at zero temperature shown in a .
 FIG. 3. Illustrative plots of the band structure for a nearestneighbor hopping only, b the t-t model, and c parametrization of Kordyuk et al. Ref. 24 of the band structure with bilayer splitting. The van Hove singularities occur where the band dispersion flattens.


