
All figures (11)

Figure 1: Evolution of monthly average real earnings in PALMSv3.3 (no adjustment) 
Figure 2: Evolution of the Gini index in PALMSv3.3 (no adjustment) 
Figure 3: Evolution of the Gini index accounting for under-reporting (1993 Q1 to 2019 Q2) 
Figure 6b: Evolution of the Gini index, household basis (1993 Q1 to 2019 Q2) 
Figure 7: Evolution of the P90/P10 dispersion ratio (1993 Q1 to 2019 Q2) 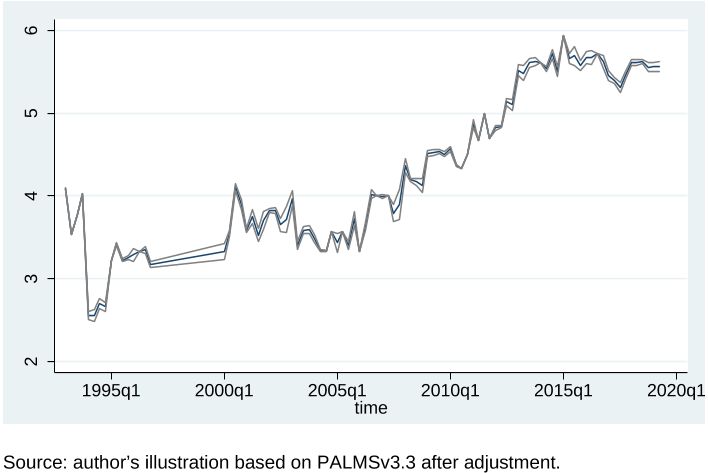
Figure 8: Evolution of the P90/P50 dispersion ratio (1993 Q1 to 2019 Q2) 
Figure 9: Evolution of the generalized entropy index (1993 Q1 to 2019 Q2) 
Figure 6b: Evolution of the Gini index, household basis (1993 Q1 to 2019 Q2) 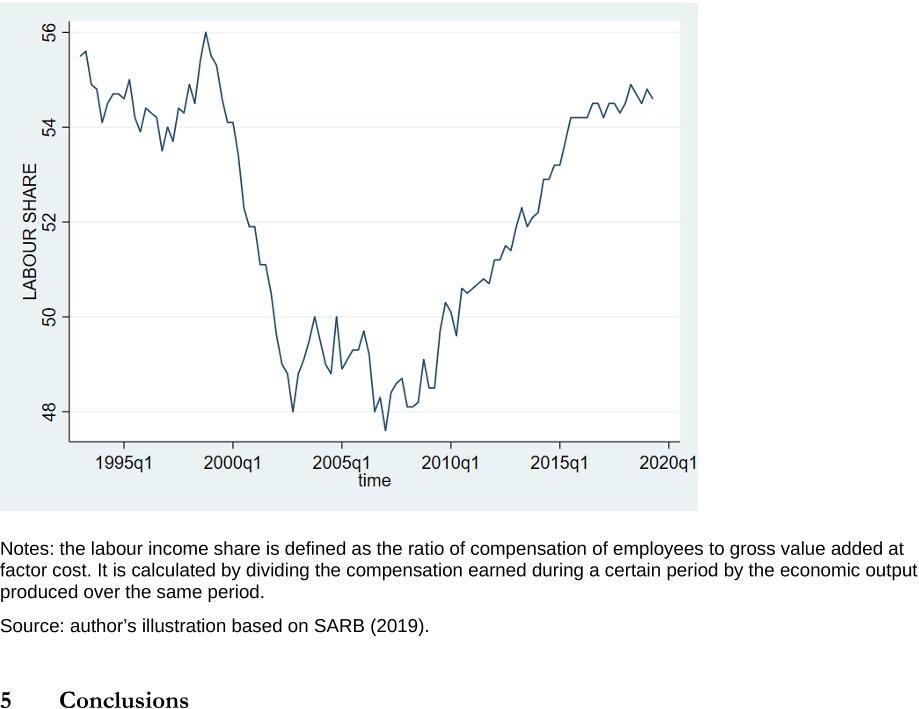
Figure 10: Evolution of the labour share of income (1993–2019 Q2) 
Figure 4: Real monthly wage frequency distribution (1994 Q4) 
Figure 5: Real monthly wage frequency distribution (2015 Q1)


