
All figures (9)

Figure 8: Load balancing – Query rate per server. 
Figure 1: Simplified request flow for handling event streams in a social networking system. We focus on reducing the throughput cost of the most complex step: querying and updating data stores (shown with thick red arrows). 
Figure 6: Actual per-client throughput of our prototype as a function of the number of servers. The first two lines have y axis on the left, the third on the right. 
Figure 7: Predicted throughput as a function of the number of servers. The first two lines have y axis on the left, the third on the right. 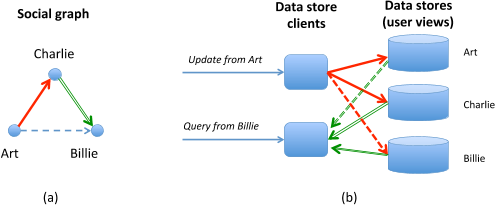
Figure 2: Example of social piggybacking. Pushes are thick red arrows, pulls double green ones. (a) The edge from Art to Billie can be served through Charlie if Art pushes to Charlie and Billie pulls from Charlie. (b) Charlie’s view is a hub. Existing approaches unnecessarily issue one of the dashed requests. 
Figure 9: Performance comparison of CHITCHAT and PARALLELNOSY on social graph samples. 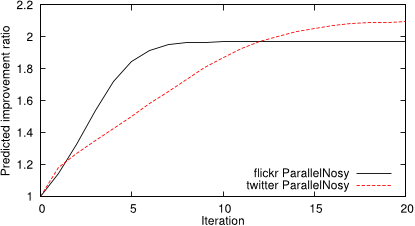
Figure 4: Predicted improvement ratio of PARALLELNOSY. 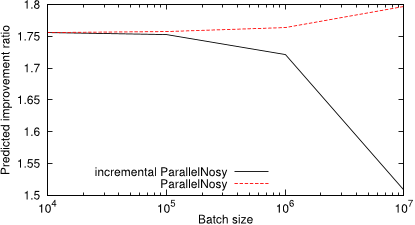
Figure 5: Predicted improvement ratio of static and incremental PARALLELNOSY, starting from half flickr graph and adding increasingly large batches of new edges. 
Figure 3: A hub-graph used in the mapping of DISSEMINATION to SETCOVER problem. Solid edges must be served with a push (if they point to w) or a pull (if they point from w). Dashed edges are covered indirectly.


01 Apr 2013-