All figures (15)

Figure 7 Model-Based Level, Slope and Curvature (i.e., Estimated Factors) vs. Data-Based Level, Slope and Curvature 
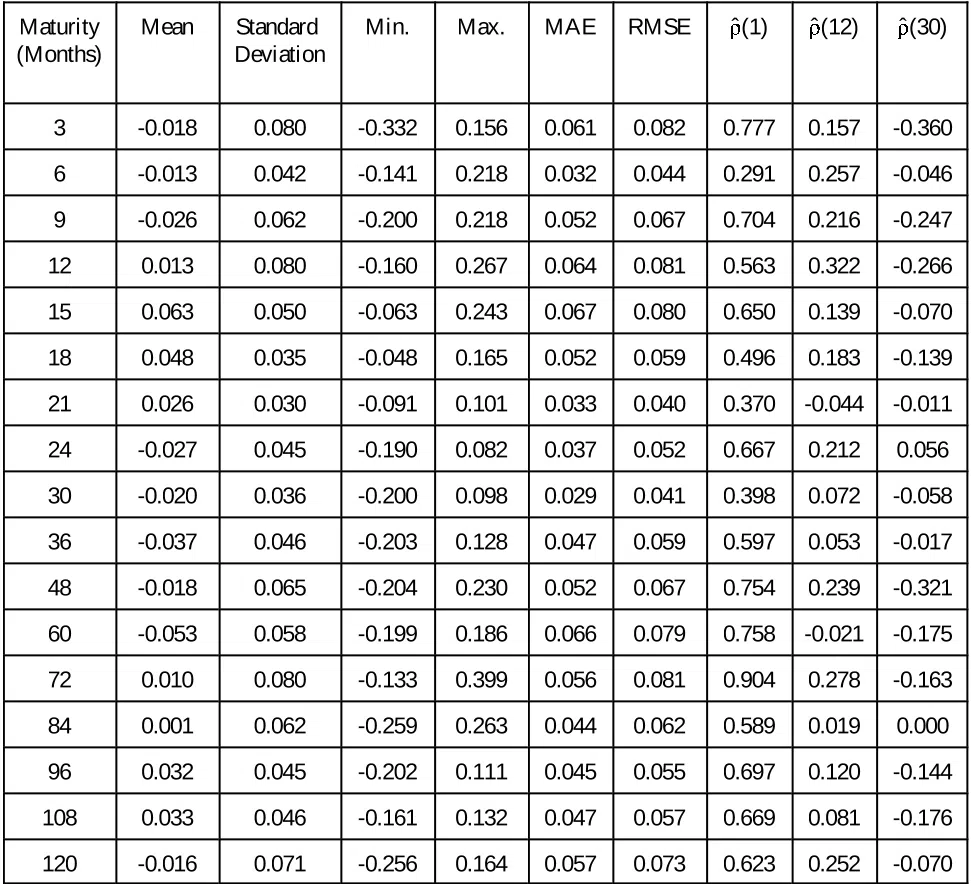
Table 1 Descriptive Statistics, Yield Curves 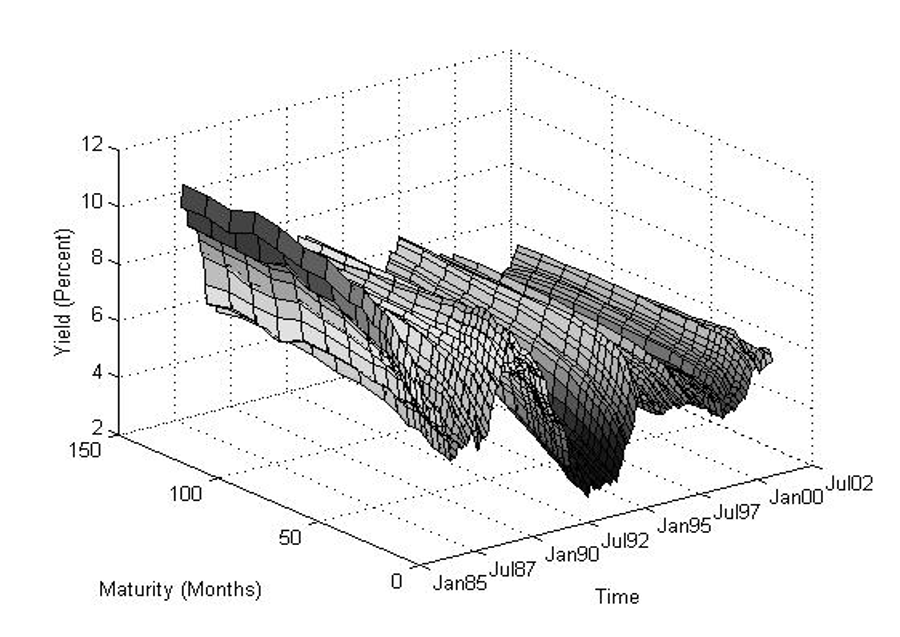
Figure 2 Yield Curves, 1985.01-2000.12 
Table 2 Descriptive Statistics, Yield Curve Residuals 
Table 5 Out-of-Sample 6-month-Ahead Forecasting Results 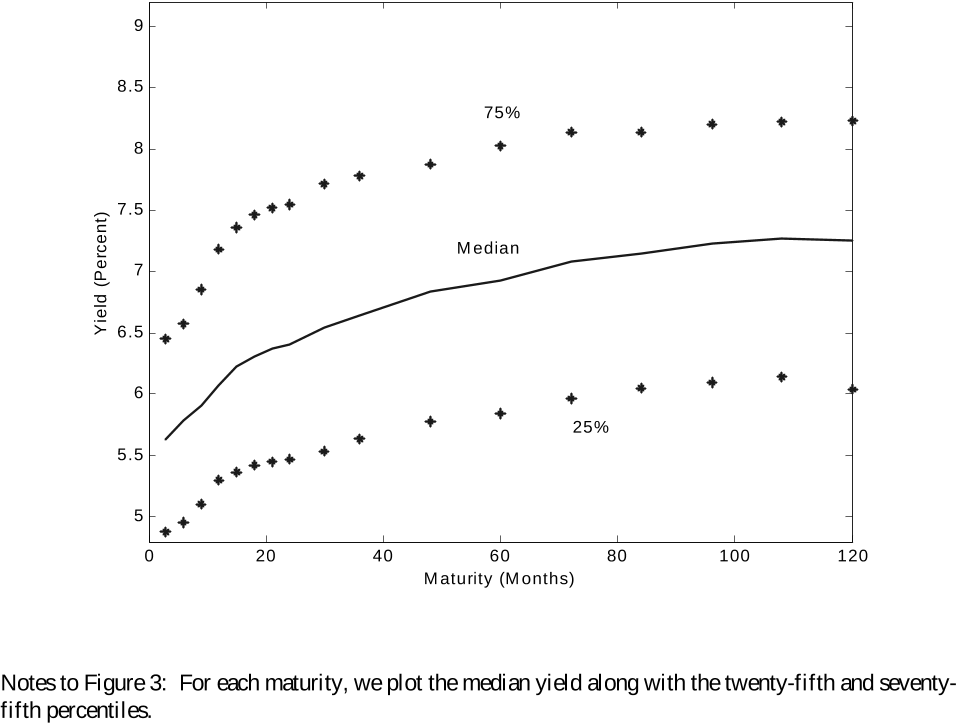
Figure 3 Median Data-Based Yield Curve with Pointwise Interquartile Range 
Figure 6 Yield Curve Residuals, 1985.01 - 2000.12 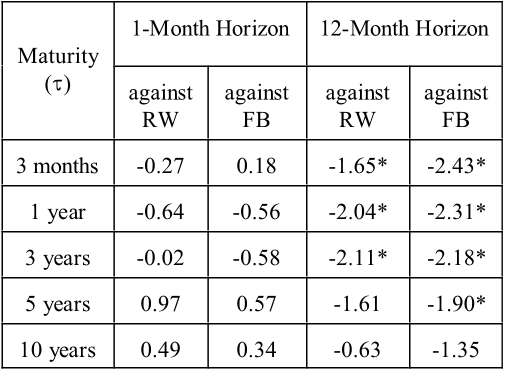
Table 7 Out-of-Sample Forecast Accuracy Comparisons 
Table 4 Out-of-Sample 1-Month-Ahead Forecasting Results 
Figure 4 Actual (Data-Based) and Fitted (Model-Based) Average Yield Curve 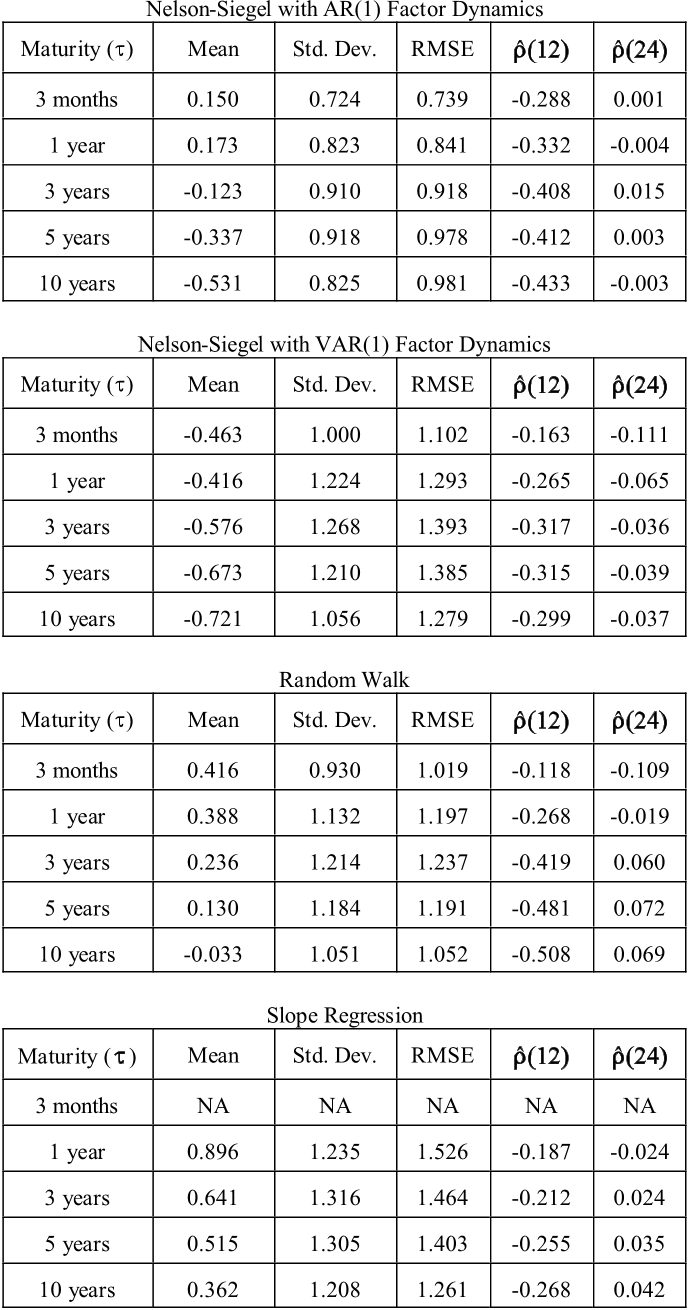
Table 6 Out-of-Sample 12-month-Ahead Forecasting Results 
Figure 8 Autocorrelations and Residual Autocorrelations of Level, Slope and Curvature Factors 
Figure 5 Selected Fitted (Model-Based) Yield Curves 
Table 3 Descriptive Statistics, Estimated Factors 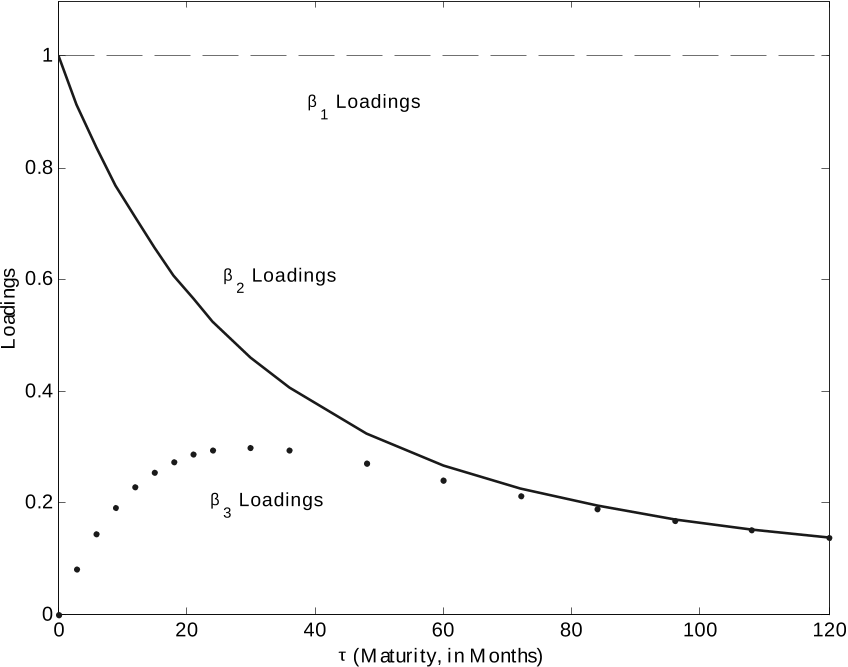
Figure 1 Factor Loadings