Search or ask a question
Pricing
Login
Sign up
Home
Notebook
Profile
Citation booster
Literature Review
Copilot
Citation generator
Paraphraser
AI Detector
Chrome Extension
Talk with us
Use on ChatGPT
All figures (5)
Figure 4: Rate of new firm formation by type of ownership 2001–2010 (Source: GSO)
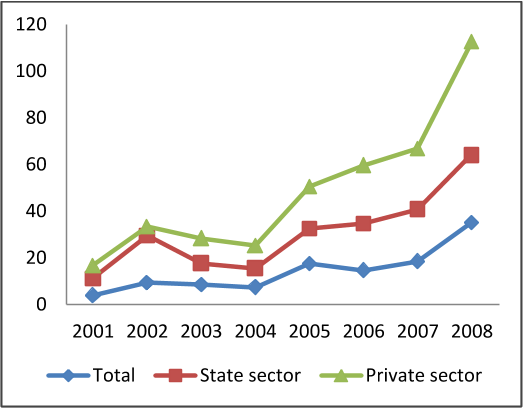
Figure 5: Growth of sales per employee by type of ownership 2001–2008 (Source: GSO)
Figure 6: Pie chart of firms by ownership types (2000 and 2005)
Figure 1: Number of firms in technology-intensive industries, 2000–2008 (Source: GSO)
Figure 2: Average firm size, 2000–2008 (Source: GSO)
Journal Article
•
DOI
•
Young innovative companies: Are they high performers in transition economies? Evidence for Vietnam
[...]
Enrico Santarelli
1
,
Hien Thu Tran
2
•
Institutions (2)
University of Bologna
1
,
Edge Hill University
2
01 Oct 2017
-
Journal of Technology Transfer