
All figures (16)
 TABLE 1. The means and standard deviations of the latitudinal and longitudinal distance of the maximum TC–extratropical flow interaction point from the recurving WNP TC at the time of maximum interaction for strong (N 5 54) and weak (N 5 54) interactions, and the differences between themeans of the strong and weak interactions (degrees). The confidence levels for the significance of the differences based on a two-sided Student’s t test are given in parentheses.
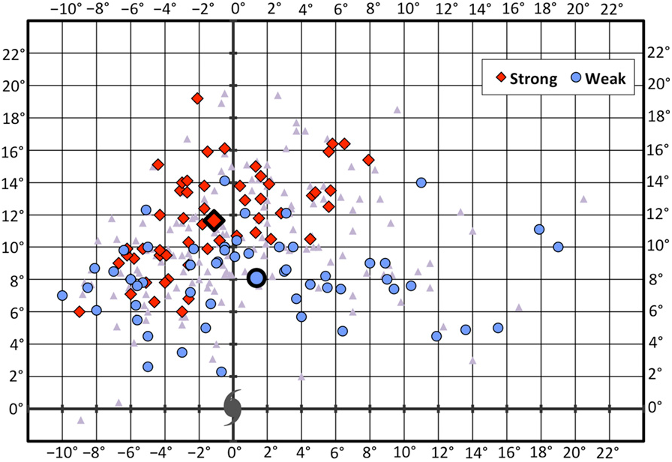 FIG. 2. Points ofmaximumTC–extratropical flow interaction plotted relative to the recurving WNPTC at the time ofmaximum interaction for strong TC–extratropical flow interactions (red diamonds; N 5 54), weak TC–extratropical flow interactions (blue circles; N 5 54), and interactions classified as neither strong nor weak (purple triangles;N5 164). The large diamond and circle represent the mean points of maximum TC–extratropical flow interaction for strong and weak interactions, respectively.
 FIG. 8. Interaction-relative composite analyses showing (a) strong (N 5 54) and (b) weak (N 5 54) TC– extratropical flow interactions at the time ofmaximum interaction.Analyses show 500-hPa ascent (dashed green, every 23 1023 hPa s21, negative values only), total-column precipitable water (shaded according to grayscale, mm), 200-hPa PV (blue, every 1 PVU), irrotational wind (vectors,.2m s21; purple vectors,.8m s21), negative PV advection by the irrotational wind (dashed red, every 2 PVUday21 starting at22 PVUday21), and total wind speed (shaded according to color bar, m s21). The star denotes the point of maximum interaction. The TC symbol denotes the composite TC position.
 FIG. 11. Interaction-relative composite analyses for (a),(c),(e) strong (N5 54) and (b),(d),(f) weak (N5 54) TC– extratropical flow interactions at the time of maximum interaction. Analyses show 250–150-hPa layer-averaged PV advection (shaded according to color bar, PVUday21), PV (contours, every 2 PVU), and wind (vectors, m s21). The TC symbol denotes the composite TC position. In (a),(b) the total and (c),(d) the nondivergent wind are used to compute PV advection and are plotted for values .18m s21, whereas in (e),(f), the irrotational wind is used to compute PV advection and is plotted for values .2m s21.
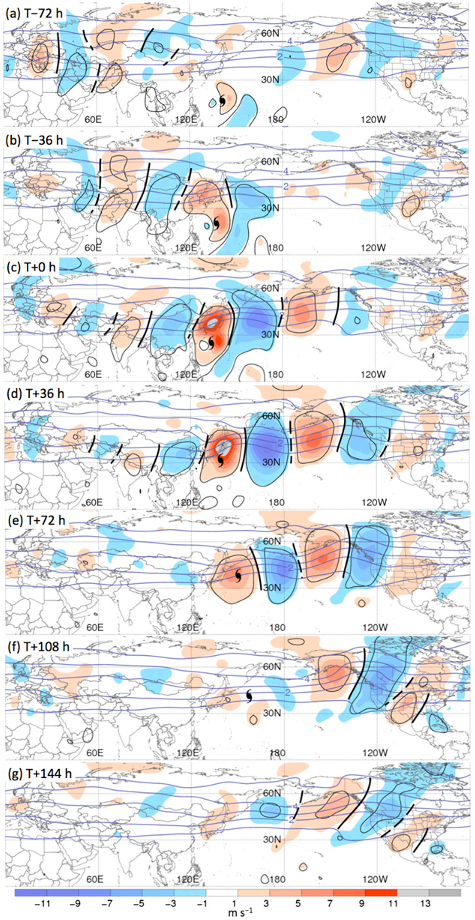 FIG. 3. Recurvature-relative composite analyses of all recurving WNP TCs (N 5 292) at 36-h intervals for (a)–(g) T 2 72 to T1 144 h. Analyses show 250-hPa meridional wind anomalies (shaded according to the color bar, m s21; enclosed by black contours where significant at the 99% confidence level) and PV (blue, every 1 PVU). The TC symbol denotes the composite TC position, which is plotted for (a)–(f) T 2 72 to T 1 108 h. Solid and dashed black lines denote subjectively identified 250-hPa ridges and troughs, respectively.
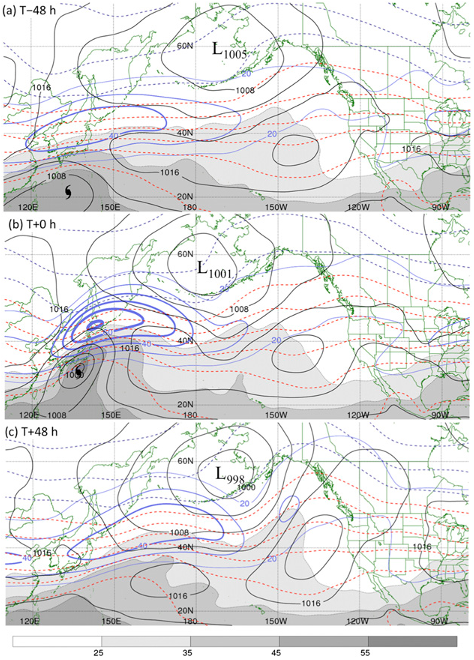 FIG. 7. Interaction-relative composite analyses of strong TC– extratropical flow interactions (N 5 54) for (a) T 2 48, (b) T 1 0, and (c) T 1 48 h. Analyses show total-column precipitable water (shaded according to grayscale,mm), sea level pressure (black, every 4 hPa), 1000–500-hPa thickness (dashed red, except dashed blue for values,540 dam; every 6 dam), and 250-hPa wind speed (solid blue, every 10m s21 starting at 20m s21). The TC symbol denotes the composite TC position, which is plotted for (a) T 2 48 and (b) T 1 0 h. The ‘‘L’’ symbol denotes the location and minimum sea level pressure (hPa) of a downstream surface cyclone.
 FIG. 13. The means (bars) and standard deviations (whiskers) of themaximum250–150-hPa layer-averaged PV frontogenesis by the total, nondivergent, and irrotational wind, respectively, for strong (N 5 54) and weak (N5 54) TC–extratropical flow interactions at the time of maximum interaction. The differences between strong and weak interactions for each quantity are significant at the 99.9% confidence level based on a two-sided Wilcoxon–Mann–Whitney rank-sum test.
 TABLE 2. The means and standard deviations of the maximum values of various quantities for strong (N5 54) and weak (N5 54) TC– extratropical flow interactions at the time of maximum interaction. The differences between strong and weak interactions for each quantity are significant at the 99.9% confidence level based on a two-sided Wilcoxon–Mann–Whitney rank-sum test.
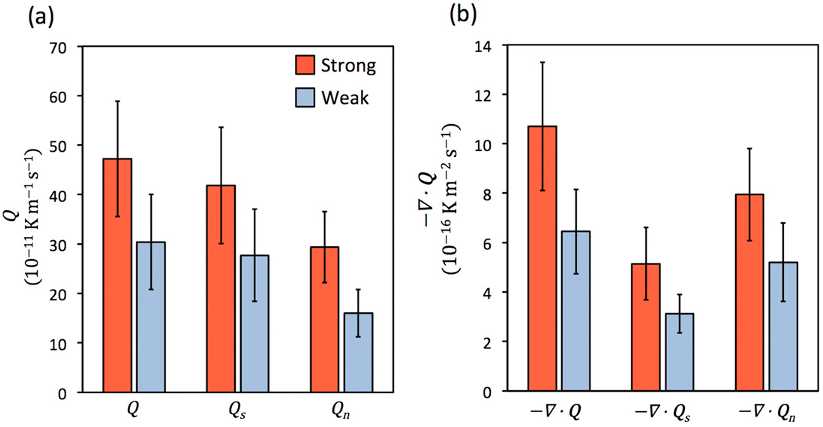 FIG. 10. The means (bars) and standard deviations (whiskers) of (a) the maximum magnitudes ofQ,Qs, andQn (10211 Km21 s21) and (b) the maximum values of the convergence of Q, Qs, and Qn (10 216 Km22 s21) at 700 hPa for strong (N5 54) and weak (N5 54) TC–extratropical flow interactions at the time of maximum interaction. The differences between strong and weak interactions for each quantity are significant at the 99.9% confidence level based on a two-sided Wilcoxon–Mann–Whitney rank-sum test.
![FIG. 4. Recurvature-relative composite Hovmöller diagram (08–608W) of the 358–608N averaged 250-hPa meridional wind anomaly (shaded, m s21) for all recurving WNP TCs (N 5 292). Thin (thick) black contours denote statistical significance at the 95% (99%) confidence level. The dashed and solid green arrows indicate estimated zonal group speeds based on the leading edge [cg 5 428 day 21 (36.5 m s21)] and peak amplitude [cg 5 378 day 21 (32.1 m s21)] of the RWT, respectively, whereas the yellow arrow indicates the estimated Rossby wave zonal phase speed [cp 5 68 day21 (5.2 m s21)]. A reference latitude of 47.58N is used to convert group and phase speeds from degree longitude per day to meters per second. The TC symbol denotes the longitude of the composite TC at recurvature.](/figures/fig-4-recurvature-relative-composite-hovmoller-diagram-08-1a0thbwp.png) FIG. 4. Recurvature-relative composite Hovmöller diagram (08–608W) of the 358–608N averaged 250-hPa meridional wind anomaly (shaded, m s21) for all recurving WNP TCs (N 5 292). Thin (thick) black contours denote statistical significance at the 95% (99%) confidence level. The dashed and solid green arrows indicate estimated zonal group speeds based on the leading edge [cg 5 428 day 21 (36.5 m s21)] and peak amplitude [cg 5 378 day 21 (32.1 m s21)] of the RWT, respectively, whereas the yellow arrow indicates the estimated Rossby wave zonal phase speed [cp 5 68 day21 (5.2 m s21)]. A reference latitude of 47.58N is used to convert group and phase speeds from degree longitude per day to meters per second. The TC symbol denotes the longitude of the composite TC at recurvature.
FIG. 4. Recurvature-relative composite Hovmöller diagram (08–608W) of the 358–608N averaged 250-hPa meridional wind anomaly (shaded, m s21) for all recurving WNP TCs (N 5 292). Thin (thick) black contours denote statistical significance at the 95% (99%) confidence level. The dashed and solid green arrows indicate estimated zonal group speeds based on the leading edge [cg 5 428 day 21 (36.5 m s21)] and peak amplitude [cg 5 378 day 21 (32.1 m s21)] of the RWT, respectively, whereas the yellow arrow indicates the estimated Rossby wave zonal phase speed [cp 5 68 day21 (5.2 m s21)]. A reference latitude of 47.58N is used to convert group and phase speeds from degree longitude per day to meters per second. The TC symbol denotes the longitude of the composite TC at recurvature.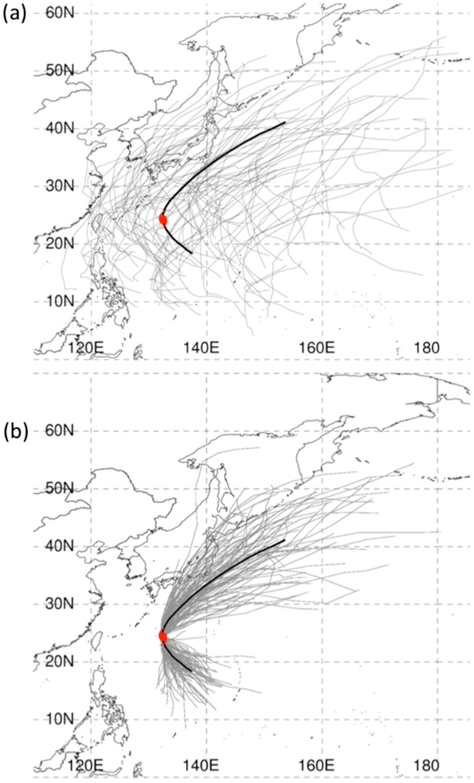 FIG. 1. RecurvingWNPTC tracks (2000–09 only;N5 101) forT2 48 to T1 72 h plotted in (a) geography-relative and (b) recurvaturerelative frameworks. The thick black curve denotes the composite track of all recurving TCs (N5 292) for T2 48 to T1 72 h. The TC symbol denotes the composite recurvature point (24.98N, 134.08E) for all recurving TCs.
![FIG. 12. Interaction-relative composite analyses for (a),(c),(e) strong (N 5 54) and (b),(d),(f) weak (N 5 54) TC–extratropical flow interactions at the time of maximum interaction. Analyses show 250–150-hPa layeraveraged PV frontogenesis [shaded, PVU (100 km)21 day21], PV (blue contours, every 2 PVU), PV gradient magnitude [black contours, every 0.5 PVU (100 km)21 starting at 0.5 PVU (100 km)21], and wind (vectors, m s21). The black dot denotes the location of the maximum PV gradient magnitude, and the TC symbol denotes the composite TC position. In (a),(b) the total and (c),(d) the nondivergent wind are used to compute PV frontogenesis and are plotted for values.18 m s21, whereas in (e),(f), the irrotational wind is used to compute PV frontogenesis and is plotted for values .2m s21.](/figures/fig-12-interaction-relative-composite-analyses-for-a-c-e-397eilqr.png) FIG. 12. Interaction-relative composite analyses for (a),(c),(e) strong (N 5 54) and (b),(d),(f) weak (N 5 54) TC–extratropical flow interactions at the time of maximum interaction. Analyses show 250–150-hPa layeraveraged PV frontogenesis [shaded, PVU (100 km)21 day21], PV (blue contours, every 2 PVU), PV gradient magnitude [black contours, every 0.5 PVU (100 km)21 starting at 0.5 PVU (100 km)21], and wind (vectors, m s21). The black dot denotes the location of the maximum PV gradient magnitude, and the TC symbol denotes the composite TC position. In (a),(b) the total and (c),(d) the nondivergent wind are used to compute PV frontogenesis and are plotted for values.18 m s21, whereas in (e),(f), the irrotational wind is used to compute PV frontogenesis and is plotted for values .2m s21.
FIG. 12. Interaction-relative composite analyses for (a),(c),(e) strong (N 5 54) and (b),(d),(f) weak (N 5 54) TC–extratropical flow interactions at the time of maximum interaction. Analyses show 250–150-hPa layeraveraged PV frontogenesis [shaded, PVU (100 km)21 day21], PV (blue contours, every 2 PVU), PV gradient magnitude [black contours, every 0.5 PVU (100 km)21 starting at 0.5 PVU (100 km)21], and wind (vectors, m s21). The black dot denotes the location of the maximum PV gradient magnitude, and the TC symbol denotes the composite TC position. In (a),(b) the total and (c),(d) the nondivergent wind are used to compute PV frontogenesis and are plotted for values.18 m s21, whereas in (e),(f), the irrotational wind is used to compute PV frontogenesis and is plotted for values .2m s21. FIG. 9. Interaction-relative composite analyses for (a),(c),(e) strong (N 5 54) and (b),(d),(f) weak (N 5 54) TC–extratropical flow interactions at the time of maximum interaction. Analyses show 700-hPa Q (vectors, .2 3 10211 Km21 s21), divergence of Q (shaded according to color bar, 10216 Km22 s21), geopotential height (solid blue, every 3 dam), and temperature (dashed red, every 38C). The TC symbol denotes the composite TC position. In (c),(d) Qs and (e),(f) Qn instead of Q are displayed and used to compute the divergence of Q.
 FIG. 5. Interaction-relative composite analyses of strong TC– extratropical flow interactions (N 5 54) at 36-h intervals for (a)–(g) T 2 72 to T 1 144 h. Analyses show 250-hPa meridional wind anomalies (shaded according to the color bar, m s21; enclosed by black contours where significant at the 99% confidence level), PV (blue, every 1PVU), and irrotational wind (vectors, .2m s21). The TC symbol denotes the composite TC position, which is plotted for (a)–(d) T 2 72 to T 1 36 h. Solid and dashed black lines denote subjectively identified 250-hPa ridges and troughs, respectively.
 FIG. 6. As in Fig. 5, but for weak TC–extratropical flow interactions (N5 54) for (a)–(d) T2 72 to T1 36 h. The TC symbol denotes the composite TC position.
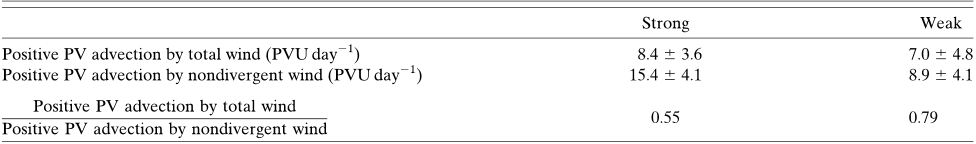 TABLE 3. The means and standard deviations of the maximum values of the 250–150-hPa layer-averaged positive PV advection by the total wind and by the nondivergent wind, respectively, and the ratios between the means, for strong (N 5 54) and weak (N 5 54) TC– extratropical flow interactions at the time of maximum interaction. The differences between strong and weak interactions for each quantity are significant at the 99.9% confidence level based on a two-sided Wilcoxon–Mann–Whitney rank-sum test.


![FIG. 4. Recurvature-relative composite Hovmöller diagram (08–608W) of the 358–608N averaged 250-hPa meridional wind anomaly (shaded, m s21) for all recurving WNP TCs (N 5 292). Thin (thick) black contours denote statistical significance at the 95% (99%) confidence level. The dashed and solid green arrows indicate estimated zonal group speeds based on the leading edge [cg 5 428 day 21 (36.5 m s21)] and peak amplitude [cg 5 378 day 21 (32.1 m s21)] of the RWT, respectively, whereas the yellow arrow indicates the estimated Rossby wave zonal phase speed [cp 5 68 day21 (5.2 m s21)]. A reference latitude of 47.58N is used to convert group and phase speeds from degree longitude per day to meters per second. The TC symbol denotes the longitude of the composite TC at recurvature.](/figures/fig-4-recurvature-relative-composite-hovmoller-diagram-08-1a0thbwp.webp)

![FIG. 12. Interaction-relative composite analyses for (a),(c),(e) strong (N 5 54) and (b),(d),(f) weak (N 5 54) TC–extratropical flow interactions at the time of maximum interaction. Analyses show 250–150-hPa layeraveraged PV frontogenesis [shaded, PVU (100 km)21 day21], PV (blue contours, every 2 PVU), PV gradient magnitude [black contours, every 0.5 PVU (100 km)21 starting at 0.5 PVU (100 km)21], and wind (vectors, m s21). The black dot denotes the location of the maximum PV gradient magnitude, and the TC symbol denotes the composite TC position. In (a),(b) the total and (c),(d) the nondivergent wind are used to compute PV frontogenesis and are plotted for values.18 m s21, whereas in (e),(f), the irrotational wind is used to compute PV frontogenesis and is plotted for values .2m s21.](/figures/fig-12-interaction-relative-composite-analyses-for-a-c-e-397eilqr.webp)


