
All figures (19)
 Fig. 4: Constructed 90◦ hybrid coupler with the corresponding magnitude measurements. The continuous (–) line denotes the simulated and the dotted (- -) the measured results.
 Fig. 5: Constructed 2×2 sub-network of Butler matrix - Phase shifter 45◦ and the reference line where the continuous (–) line denotes the simulated and the dotted (- -) the measured results.
 Fig. 8: Insertion losses of Butler matrix exciting port 1. The continuous (–) line denotes the simulated and the dotted (- -) the measured results.
 Fig. 6: Phase difference between the output ports of the coupler of Fig. 4 and the phase shifter of Fig. 5.
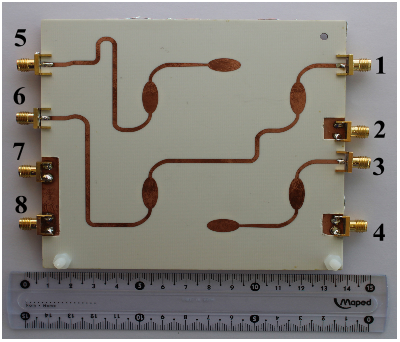 Fig. 7: Constructed prototype of 4× 4 Butler matrix.
 Fig. 1: Illustration of dividing data traffic into macro and small cells and the block diagram of the proposed system.
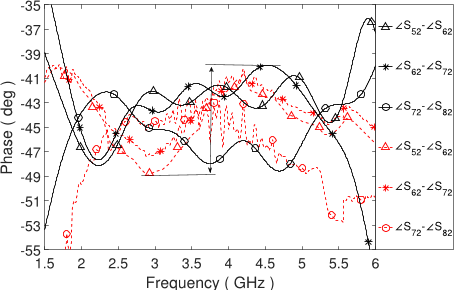 Fig. 11: Phase difference of the consecutive output ports of Butler matrix exciting port 2. The continuous (–) line denotes the simulated and the dotted (- -) the measured results.
 Fig. 10: Phase difference of the consecutive output ports of Butler matrix exciting port 1. The continuous (–) line denotes the simulated and the dotted (- -) the measured results.
 Fig. 9: Reflection and isolation coefficients of Butler matrix exciting port 1. The continuous (–) line denotes the simulated and the dotted (- -) the measured results.
 TABLE II: Comparison of switched beam systems
 Fig. 19: Antenna array (Array) and system efficiency (System) for the beams (a) 1R and (b) 2R of Fig. 2. The notation (m) and (s) at the legends indicates the measured and simulated results respectively.
 Fig. 17: Simulated and measured radiation pattern at 2, 3, 4 and 5 GHz. The beam 1L is annotated with ∗, the 2L with +, the 2R with ◦ and the 1R with . The legend and scale on the normalized gain are the same in all graphs.
 Fig. 18: (a), (b) System gain of the whole beamforming network for all the beams (2R,1R,2L,1L) of Fig. 2 (Vivaldi array and Butler matrix (c) Measurement set up in the anechoic chamber).
 TABLE I: Ideal complex excitation currents at the antenna array elements.
 Fig. 2: The hybrid switched beam system block diagram.
 Fig. 12: Vivaldi array (a) middle and (b) edge stub (c) prototype. Dimensions in mm: a=127.6, b = 24.8, c=14.2, d=36, e=50, f=0.9, g=3.4, h=14, i=0.9, j=1.8, k=1.2, l=2.8, m=7, n=7, o=2.8, r=1.1, s=1.3, p=3.7
 Fig. 13: Co-polarization and cross-polarization comparison of the Vivaldi array with and without the soft surface for the broadside beam (φ = 90◦) at 3 GHz.
 Fig. 3: (a) Butler matrix block diagram with the continuous and dashed lines defining different layers (b) Top layered view of the developed Butler matrix where the middle copper layer is with brown color and the top bottom copper layers with light dark and light yellow shades. The denoted dimensions in mm: ds = 13.7, dl = 14.9, dw = 6.1, dps = 13, dpl = 13.8, dpw = 5.9. (c) 3D layered illustration of the hybrid coupler and top perspective same as (b).
 Fig. 16: Cascaded S-parameters of Vivaldi antenna array exciting separately the input ports of Butler matrix. The continuous (–) line denotes the simulated and the dotted (- -) the measured results.


