
All figures (12)

Figure 6. MAMCA results for the bottom-10 world cities – in terms of efficiency – from the perspective of all classes of stakeholders (with Paris as a benchmark) 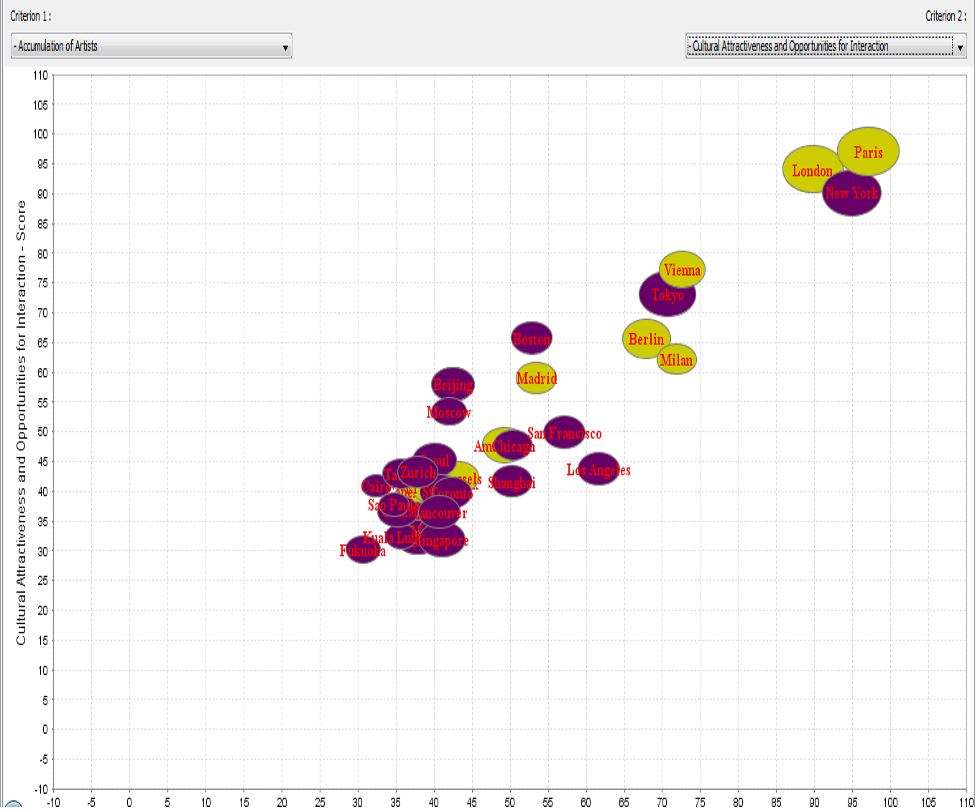
Figure 11. A (concentration of artists)- versus B (cultural attractiveness)- analysis for all cities 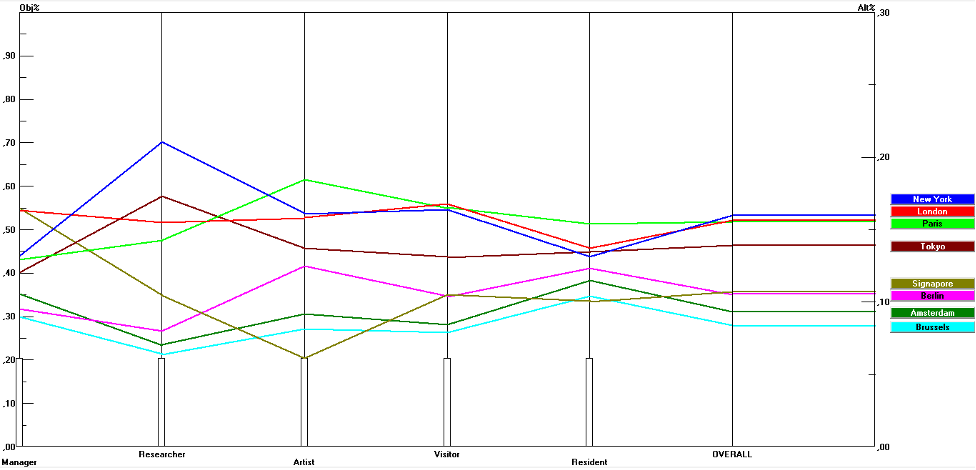
Figure 3. MAMCA results for 8 world cities from the perspective of all classes of stakeholders 
Figure 2. MAMCA results for 8 world cities from the perspective of the class of ‘visitors’ 
Figure 12. GAIA plane for 7 world cities, as compared to Figures 2 and 3 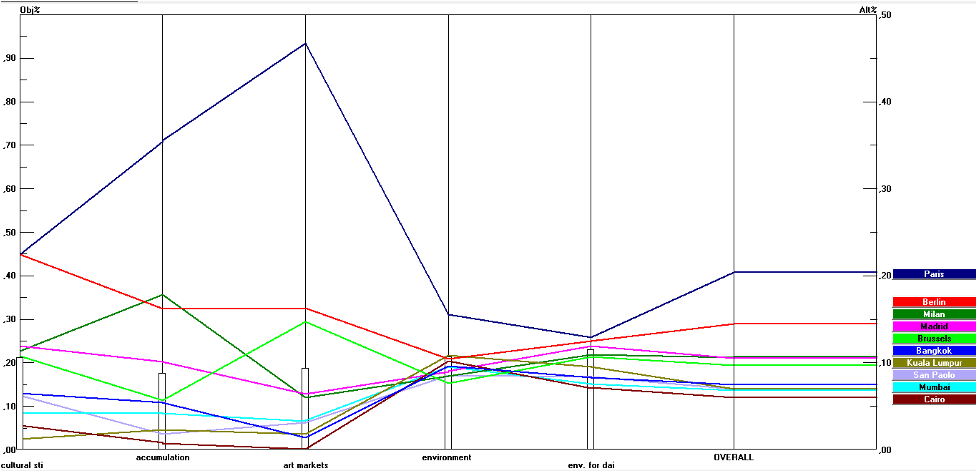
Figure 7. MAMCA results for the bottom-10 world cities – in terms of efficiency – from the perspective of the class of ‘artists’ (with Paris as a benchmark) 
Figure 8. GAIA plane with topological positions for the selected EU and non-EU top-10 cities 
Figure 9. Overall ranks of the top-10 cities on the basis of the PROMETHEE method 
Figure 5. MAMCA results for the top-10 most efficient world cities from the perspective of the class of ‘visitors’ 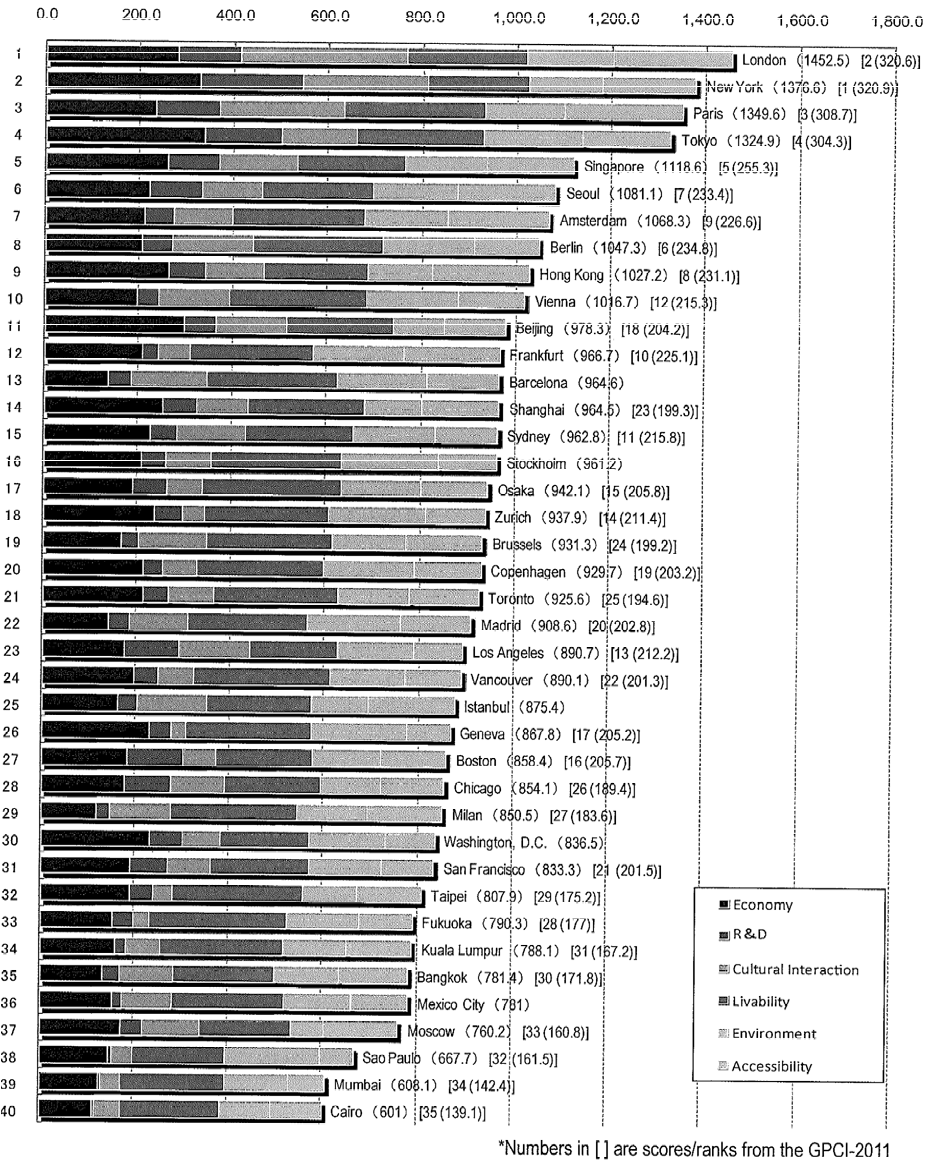
Figure 1. Comprehensive scores and ranking of 40 global cities by 6 functions Source: Mori Memorial Foundation (2012) 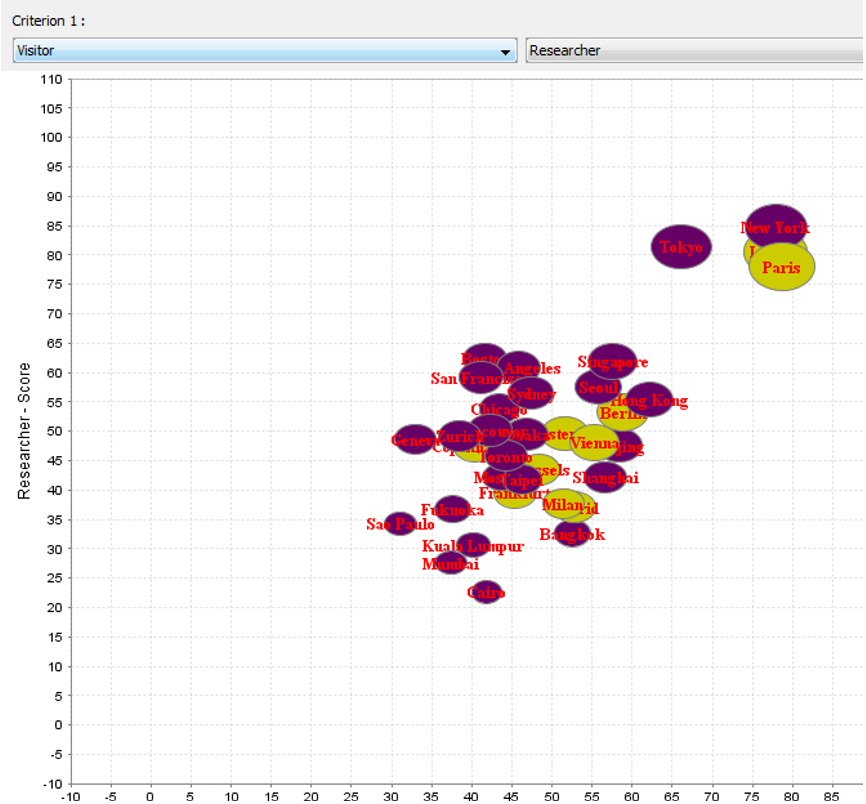
Figure 10. A (visitor)- versus B (researcher)- analysis with all cities (green: EU countries, purple: non-EU countries). 
Figure 4. MAMCA results for the top-10 most efficient world cities from the GPCI database, from the perspective of all classes of stakeholders


