
All figures (58)

Figure 1 – Non-Attainment Areas 
Figure 2 – Transportation Impacts on GHG Emissions 
Figure 16 – Gas Chromatogram after 15 Hour Reaction Time 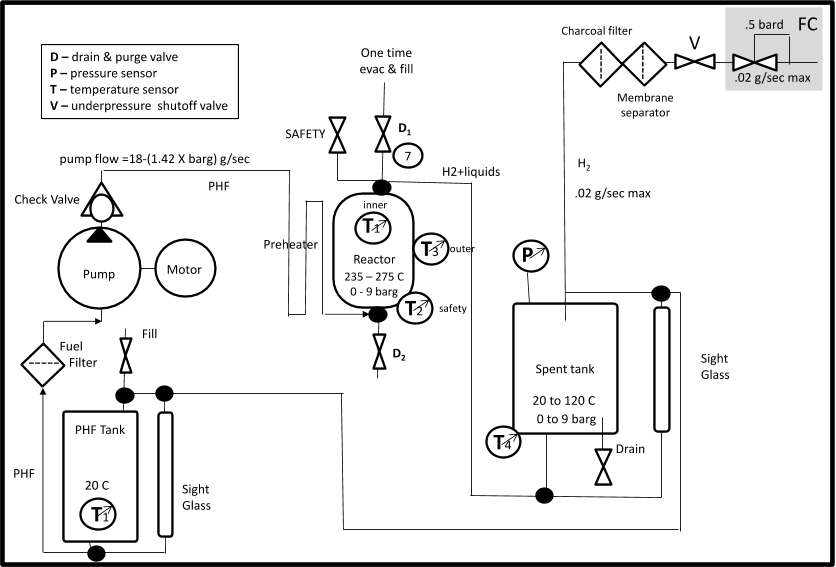
Figure 31 – Demonstration Fuel System Schematic 
Table 6 – Dehydrogenation Results for In-house Catalyst with Reactor Bypass 
Table 5 – Dehydrogenation results for HDS-2A Catalyst with Reactor Bypass 
Table 13 – Product Peaks for 5% Pd and Neat Fuel at 250oC (T=60 min) 
Figure 26 – GC Analysis of 5% Pd Monolith Reactor with Neat Fuel 
Figure 13 – Air Products Liquid Carrier Process 
Figure 18 – GC Analysis of 1% Pt Monolith and 50/50 Fuel Mix at 220oC 
Figure 43 – Fuel System Installation 
Figure 10 – Liquid Carrier Molecules Used For Prototype Fuel System Demonstration 
Figure 35 – Demonstration Fuel System Test Installation 
Figure 17 – H NMR Spectrum for Perhydrofluorene. 
Table 8 – Product Peaks after 15 Hour Reaction Time 
Figure 27 – GC Analysis of 5% Pd Monolith Reactor with Neat Fuel at 270 °C 
Table 14 – Product Peaks for 5% Pd Monolith Reactor at 270°C (T=0 min) 
Figure 11 – Experimental Reactor 
Figure 21 – GC Analysis of 1% Pd Monolith and 50/50 Fuel Mix at 250oC 
Figure 20 – Reaction Products for 5% Pt Monolith and 50/50 Fuel Mix at 220oC 
Figure 8 – Auto Company Participants in the Pilot AVF 
Figure 30 – Fuel System States 
Figure 19 – GC Analysis of 5% Pt Monolith and 50/50 Fuel Mix at 220oC 
Table 10 – Product Peaks for 5% Pt Monolith and 50/50 Fuel Mix at 220oC (T=90 min) 
Figure 22 – Reaction Products for 1% Pd Monolith and 50/50 Fuel Mix at 250oC 
Table 11 – Product Peaks for 1% Pd Monolith and 50/50 Fuel Mix at 250oC (T=0 min) 
Table 7 – Product Peaks after 9 Hours Reaction Time 
Figure 34 – Demonstration Fuel System 
Table 1 – Composition of American Cyanamid Catalysts 
Figure 32 – Demonstration Reactor Build-up 
Table 2 – Dehydrogenation results for HDS-20A Catalyst (07July2010) 
Table 3 – Dehydrogenation results for HDS-20A Catalyst (08July2010) 
Figure 33 – Fuel System Controller Schematic 
Figure 15 – 2,3,4,4a,9,9a-hexahydro-1H-Fluorene Partial Hydrogenation Byproduct 
Figure 40 – Comparison of Experimental and Demonstration Reactor Test Results (T=270oC) 
Figure 7 – Electric Vehicle Powertrain Business Model Convergence 
Figure 39 – Demonstration Fuel System Test Results – Test 3 (T=270oC) 
Figure 4 – Functions Performed by Community Based Non-Profit Innovation Centers 
Figure 3 – Functions Performed by University Based Innovation Centers 
Figure 28 – Comparison of Diluted and Neat Fuel Test Results 
Table 15 – Effect of Temperature on Reactor Performance 
Figure 23 – GC Analysis of 5% Pd Monolith and 50/50 Fuel Mix at T=250oC 
Table 12 – Product Peaks for 5% Pd Monolith and 50/50 Fuel Mix at T=250oC (T=30 min) 
Figure 38 – Comparison of Experimental and Demonstration Reactor Test Results (T=250oC) 
Figure 9 – Technology Transition Valley of Death 
Figure 41 – Demonstration Fuel System Test Results – Test 4 (Fanfold) 
Table 9 – Product Peaks for 1% Pt Monolith and 50/50 Fuel Mix at 220oC (T=15 min) 
Figure 29 – SCIES Hybrid Electric Test Vehicle 
Figure 14 – Gas Chromatogram after 9 Hours Reaction Time 
Table 4 – Dehydrogenation results for HDS-2A Catalyst 
Figure 12 – Process Flow Diagram 
Figure 5 – Characteristics of University Based Innovation Centers 
Figure 6 – Characteristics of Community Based Non-Profit Innovation Centers 
Figure 24 – Reaction Products for 5% Pd Monolith and 50/50 Fuel Mix at 250oC 
Figure 25 – Comparison of Fluorene Production Results for Three Monoliths 
Figure 42 – Comparison of Demonstration Fuel System Test Results 
Figure 37 – Demonstration Fuel System Test Results – Test 2 (T=250oC) 
Figure 36 – Demonstration Fuel System Test Results – Test 1 (T=235oC)


