
All figures (20)
 Fig. 5. Academic example illustrating the limitation of the SA when applied to a single dof system excited by a linear chirp. (a) Reference instantaneous frequency, (b) constant amplitude linear chirp synchronous with the 15th order of the reference instantaneous frequency, (c) amplitude and (d) phase spectrum of the single dof linear system, (e) angular resampled response, (f) response order spectrum, (g) SA, (h) SA order spectrum, (i) residual signal, and (j) residue order spectrum. Note that the SA energy comprises only 13.94% of the response energy.
 Fig. 10. (a) Acceleration signals acquired at operating speeds (a) 650 rev/min, (b) 950 rev/min, (c) 1250 rev/min, (d) 1550 rev/min and (e) 1850 rev/min.
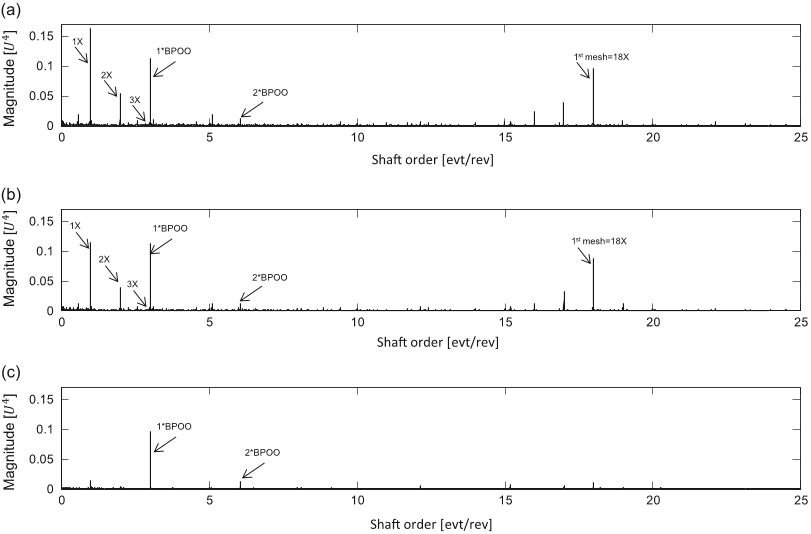 Fig. 19. SES of the (a) resampled signal, (b) the SA residue and (c) the GSA residue applied on signal Acc2 in runup.
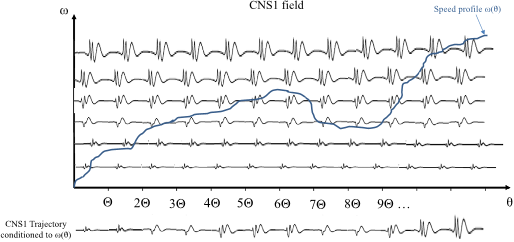 Fig. 2. Trajectory of a CNS1 signal conditioned to a given speed profile ω(θ). Each horizontal slice in this field associated with a fixed speed value ω represents a CS process with specific statistics. A CNS process is then a trajectory in this field defined by the speed profile.
 Table 1 Characteristic of the rolling element bearing (Deep groove ball 6820).
 Fig. 9. The test rig located at CETIM.
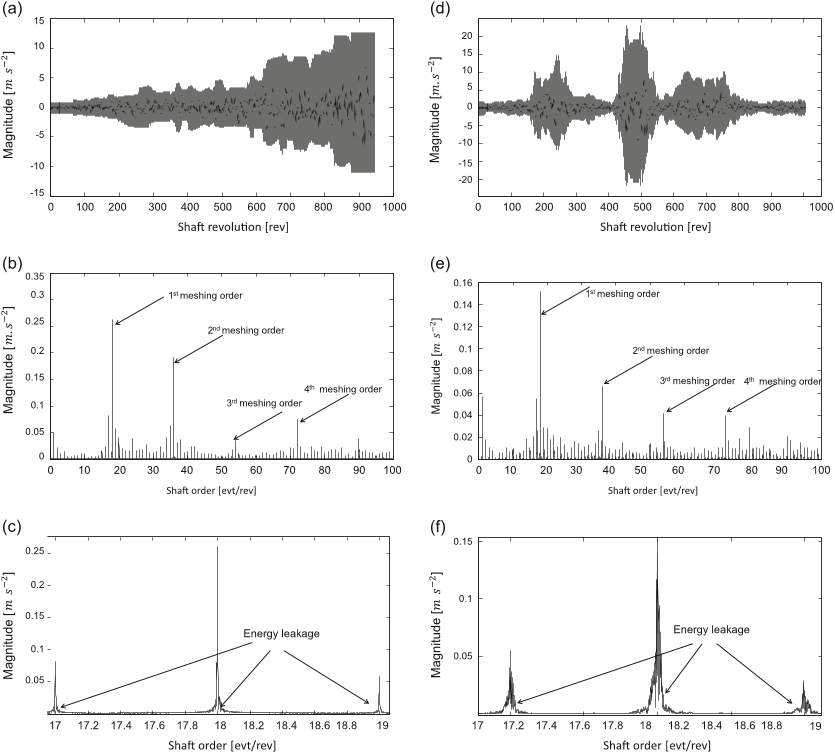 Fig. 16. (a) GSA of signal Acc1 in runup speed regime estimated with 20 non-overlapping intervals, (b) its amplitude order spectrum and (c) its zoom around the 1st meshing order. (d) GSA estimate of signal Acc2 in random speed regime estimated with 20 non-overlapping intervals, (e) its amplitude order spectrum and (f) its zoom around the 1st meshing order.
 Fig. 15. Classical SA (a) and GSA applied on signal Acc1 in runup speed profile for the speeds (b) 650 rev/min (c), 950 rev/min (d), 1250 rev/min (e), 1550 rev/min and (f) 1850 rev/min. The same unit scale is used to evidence the differences.
 Fig. 8. Percentage evolution of the GSA energy (with respect to the energy of the actual response) with the number of regimes for 10 s time record.
 Fig. 7. (a) Order spectrum of the actual response and GSA estimates obtained with different speed resolutions and (b) percentage evolution of the GSA energy (with respect to the energy of the actual response) with the numbers of regimes for 10 s time record.
 Fig. 3. Flow-chart of the GSA raw estimator.
 Fig. 17. Amplitude order spectrum of the SA and GSA residues of Acc2 in runup speed regime, close-ups around (a) the 1st meshing harmonic, (b) the 2nd meshing harmonic and (c) the 3rd meshing harmonic. Amplitude order spectrum of the SA and GSA residues of Acc1 signal in random speed-varying regime, close-ups around (d) the 1st meshing harmonic, (e) the 2nd meshing harmonic and (f) the 3rd meshing harmonic.
 Fig. 14. Comparison between the GSA of signal Acc1 acquired at runup and the GSA of the same accelerometer acquired at random variable speed: (a) 650 rev/min, (b) 950 rev/min, (c) 1250 rev/min, (d) 1550 rev/min, (e) 1850 rev/min; (f)–(j) are the close-ups between 0 and 0.3 rev of plots (a)– (e) respectively.
 Fig. 13. Comparison between the SA of signal Acc1 acquired at constant speeds and the GSA of the same accelerometer acquired in random variable speed: (a) 650 rev/min, (b) 950 rev/min, (c) 1250 rev/min, (d) 1550 rev/min, (e) 1850 rev/min; (f)–(j) are the absolute differences of the plots in (a)–(e) respectively and their corresponding threshold.
 Fig. 6. (a) Actual deterministic response and GSA estimate together with their (b) order spectra. The estimation comprises 92.43% of the energy of the actual response.
 Fig. 4. Flow-chart of the proposed method.
 Fig. 18. Comparison of the SES of residue, the SES of SA residue and the SES of the GSA residue.
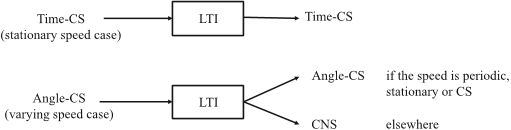 Fig. 1. Transmission path effect on cyclostationary excitations.
 Fig. 11. (a) Runup speed profile and (b) its corresponding acceleration signals (Acc1 and Acc2). (c) Random speed profile and (d) its corresponding acceleration signals (Acc1 and Acc2).
 Fig. 12. Comparison between the SA of Acc1 signal acquired at constant speeds and the GSA of the same accelerometer acquired in runup: (a) 650 rev/min, (b) 950 rev/min, (c) 1250 rev/min, (d) 1550 rev/min, (e) 1850 rev/min; (f)–(j) are the absolute differences of the plots in (a)–(e) respectively and their corresponding threshold.


