
All figures (10)

Table 2. Wheat shotgun metagenomic sequencing data quality. 736 
Fig. 2. Map of occurrence of wheat curl mite-transmitted viruses in eastern Colorado during 815 2019 as determined by RT-qPCR analysis Symptomatic leaf tissues were collected from various 816 locations or obtained from extension agents and growers. The number of samples tested in each 817 county ranged from one to six. Map was generated using mapchart.net. 818 
Table 1. Primers used for PCR analysis in this study. 733 
Fig. 3. Phylogenetic tree of wheat streak mosaic virus (WSMV) isolates using WSMV-NIb 847 region. Scale bar indicates percent genetic distances. Phylogenetic analysis by maximum 848 likelihood method was based on a sequence alignment using ClustalW in MEGAX. Bootstrap 849 values less than 65% out of 1000 replicates are not shown. 850 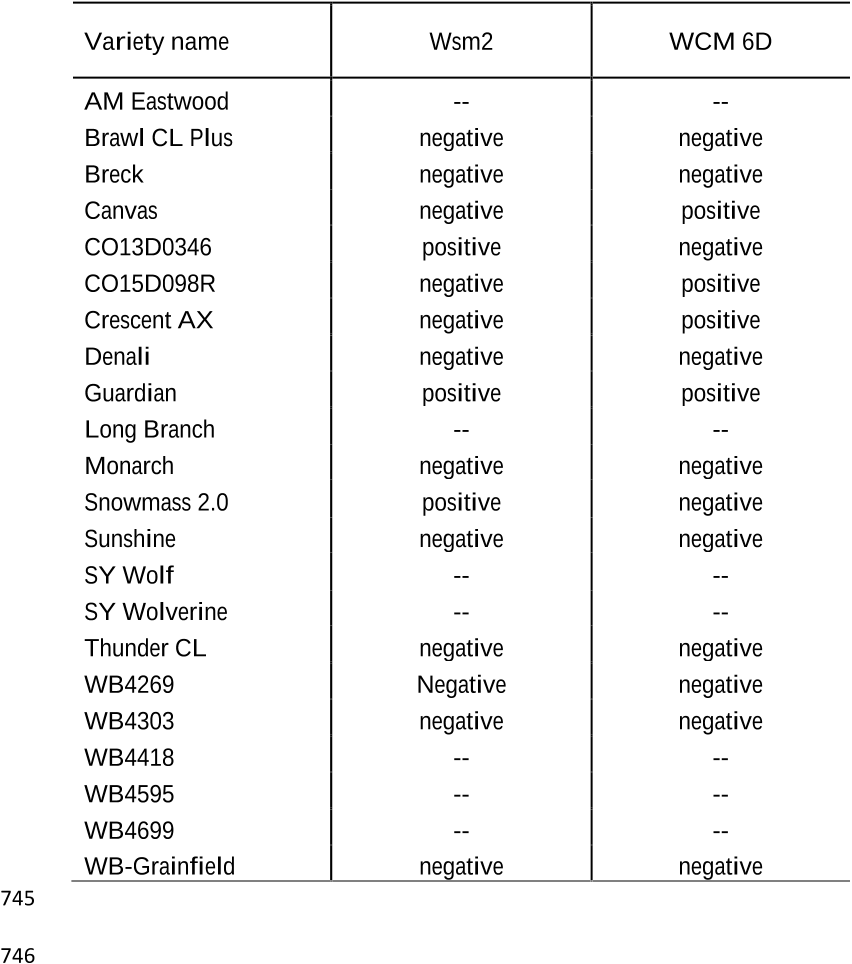
Table 4. Presence of virus (Wsm2) and mite resistance (WCM 6D) genes in varieties tested at the 742 Colorado State University Irrigated Variety Performance Trial. Blanks indicate that presence of 743 resistance marker was not tested in these lines. 744 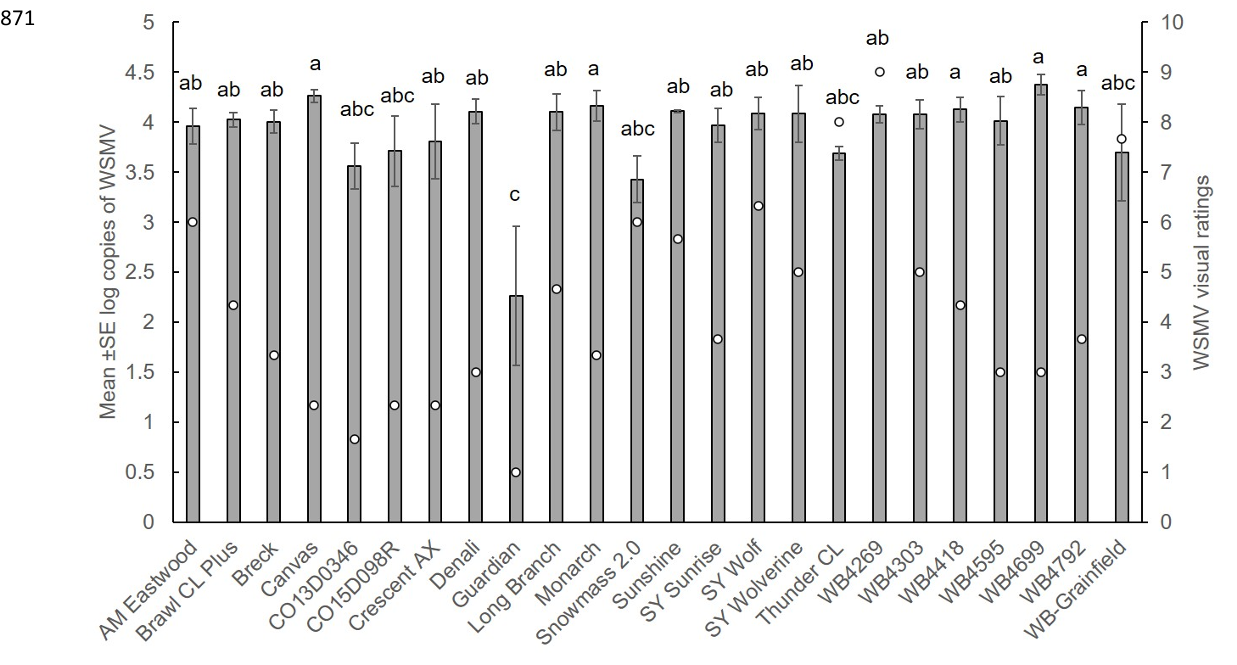
Fig. 6. Response of wheat varieties and CSU advanced breeding lines to natural infection of wheat streak mosaic virus (WSMV) in an 867 irrigated variety trial. Bars indicate mean of three biological replicates ± SE log copies of WSMV per variety. Circles indicate average 868 WSMV visual rating on a 0-9 scale where 1= no damage and 9=severe damage. Different letters indicate significant differences 869 between varieties at P<0.05. 870 
Fig. 4. Amino acid variability in WSMV polyprotein amino acid sequences of Colorado isolates compared to seven Kansas isolates 854 (Fellers et.al. 2019) and the reference strains, Sidney81 (AF057533) and Type (AF285169). Black box highlights common change 855 between Sidney 81 and the other isolates reported in Fellers et.al. 2019. Alignments and visualization was performed using ClustalW. 856 
Table 3. Summary of wheat viromes from Colorado. 739 
Fig. 5. Phylogenetic tree of High Plains wheat mosaic virus (HPWMoV) isolates using the 861 complete RNA3 segment encoding the nucleoprotein. Scale bar indicates percent genetic 862 distances. Phylogenetic analysis by maximum likelihood method was based on a sequence 863 alignment using ClustalW in MEGAX. Bootstrap values less than 70% out of 1000 replicates are 864 not shown. 865 
Fig. 1. Phylogenetic tree of wheat curl mite populations using the ribosomal internal transcribed 775 spacer (ITS1) region. Scale bar indicates percent genetic distances. Phylogenetic analysis by 776 maximum likelihood method was based on a sequence alignment using ClustalW in MEGAX. 777 Bootstrap values less than 70% out of 1000 replicates are not shown. 778


